spkit.sineModel_synthesis
- spkit.sineModel_synthesis(fXt, mXt, pXt, fs, overlap, crop_end=False)
Synthesis of signal x using the Sinusoidal Model
Synthesis of signal x using the Sinusoidal Model
Synthesing signal for given frequencies with magnitude sinasodal tracks
- Parameters:
- fXtfrequency tracks - 2d-array- shape =(number of frames, number of sinasodal tracks)
- mXtmagnitude - same size of array as
- pXtphases of sinusoids
- fssampling frequency
- overlap: overlap of consequitive frames (in samples)
- Returns:
- y1d-array - synthesised signal
See also
dft_analysisDiscreet Fourier Transform - DFT
dft_synthesisInverse Discreet Fourier Transform - iDFT
stft_analysisShort-Time Fourier Transform - STFT
stft_synthesisInverse Short-Time Fourier Transform - iSTFT
frftFractional Frourier Transform - FRFT
ifrftInverse Fractional Frourier Transform - iFRFT
sineModel_analysisSinasodal Model Decomposition
sineModel_synthesisSinasodal Model Synthesis
Notes
#TODO
Examples
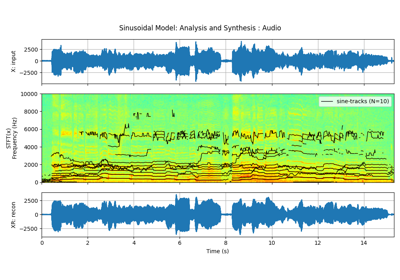
    import requests
    from scipy.io import wavfile
    import numpy as np
    import matplotlib.pyplot as plt
    import spkit as sp
    path = 'https://github.com/MLEndDatasets/samples/raw/main/HWD_HP_hum_1.wav?raw=True'
    req = requests.get(path)
    with open('downloaded_file.wav', 'wb') as f:
            f.write(req.content)
    fs, x = wavfile.read('downloaded_file.wav')
    t = np.arange(x.shape[0])/fs
    N=10
    fXst, mXst, pXst = sp.sineModel_analysis(x,fs,winlen=3001,overlap=750,
                            window='blackmanharris', nfft=None, thr=-10,
                            maxn_sines=N,minDur=0.01, freq_devOffset=10,freq_devSlope=0.1)
    xr = sp.sineModel_synthesis(fXst, mXst, pXst,fs,overlap=750,crop_end=False)
    mXt, pXt = sp.stft_analysis(x,winlen=3001,overlap=750,plot=False)
    fXt1 = (fXst.copy())*(mXst>0)
    fXt1[fXt1==0]=np.nan
    tx = t[-1]*np.arange(fXt1.shape[0])/fXt1.shape[0]
    fig, (ax1, ax2,ax3) = plt.subplots(3, 1, gridspec_kw={'height_ratios': [1,2,1]},figsize=(10,6))
    ax1.plot(t,x)
    ax1.set_xlim([t[0],t[-1]])
    ax1.set_ylabel('X: input')
    ax1.grid()
    ax1.set_xticklabels('')
    ax2.imshow(mXt.T,aspect='auto',origin='lower',cmap='jet',extent=[t[0],t[-1],0,fs/2],interpolation='bilinear')
    ax2.plot(tx,fXt1,color='k',lw=1,label='sin-tracks')
    ax2.set_ylabel('STFT(x)
Frequency (Hz)')
    ax2.set_xticklabels('')
    ax2.set_ylim([0,10000])
    ax2.legend([f'sine-tracks (N={N})'])
    ax3.plot(t,xr[:len(t)])
    ax3.set_xlim([t[0],t[-1]])
    ax3.set_ylabel('XR: recon')
    ax3.grid()
    ax3.set_xlabel('Time (s)')
    fig.suptitle('Sinusoidal Model: Analysis and Synthesis')
    plt.tight_layout()
    plt.show()