spkit.dft_analysis
- spkit.dft_analysis(x, window='blackmanharris', N=None, scaling_dB=True, normalize_win=True, plot=False, fs=None)
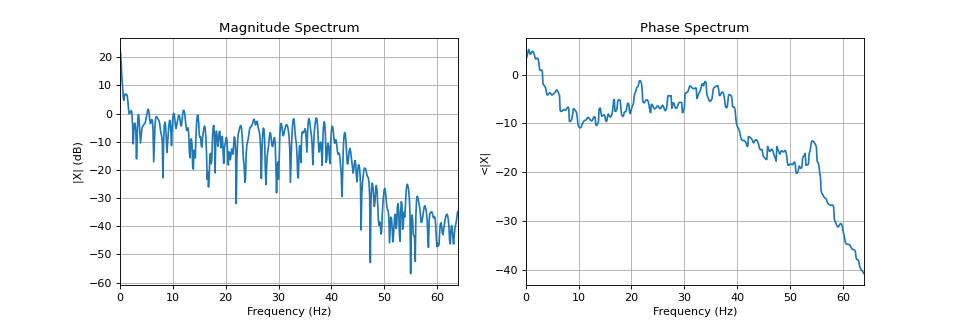
Discrete Fourier Transform: Analysis (DFT)
Analysis of a signal x using the Discrete Fourier Transform
- Parameters:
- x: 1d-array,
input signal ofshape (n,)
- window: window-type, default = ‘blackmanharris’
if None, rectangular window is used
- Nint, default =None
FFT size, should be >= len(x) and power of 2
if None then N = 2**np.ceil(np.log2(len(n)))
- scaling_dB: bool, default True
if false, then linear scale of spectrum is returned, else in dB
- normalize_win: bool (default True),
if to normalize wondow (recommended)
- plot: int, (default: 0) for no plot
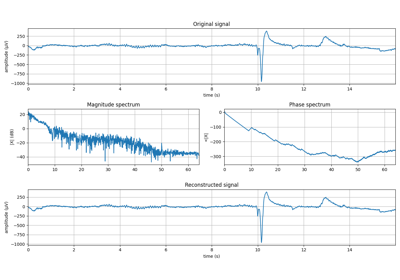
: 1 for plotting magnitude and phse spectrum : 2 for ploting signal along with spectrum
- fsint, deafult=None
sampling frequency, only used to plot the signal when plot=2
if not provided, fs=1 is used
it does not affect any computations
- Returns:
- mX: magnitude spectrum (of shape=int((N/2)+1)) # positive spectra
- pX: phase spectrum same shape as mX
- NN-point FFT used for computation
See also
dft_synthesisInverse Discreet Fourier Transform - iDFT
stft_analysisShort-Time Fourier Transform - STFT
stft_synthesisInverse Short-Time Fourier Transform - iSTFT
frftFractional Frourier Transform - FRFT
ifrftInverse Fractional Frourier Transform - iFRFT
sineModel_analysisSinasodal Model Decomposition
sineModel_synthesisSinasodal Model Synthesis
Notes
#TODO
References
Examples
#sp.dft_analysis
import numpy as np
import matplotlib.pyplot as plt
import spkit as sp
x,fs = sp.data.eeg_sample_1ch(ch=1)
x = x[:int(fs*5)]
t = np.arange(len(x))/fs
mX, pX, N = sp.dft_analysis(x,plot=True,fs=fs)