spkit.simplify_signal
- spkit.simplify_signal(x, fs, winlen, overlap, N=1, mag=-1, thr=-20, minDur=0.01, freq_devOffset=10, freq_devSlope=0.1, window='blackmanharris')
Simplify a signal with Sinasodal Model
Simplify a signal with Sinasodal Decomposition-Recomposition Model
Reconstructing a signal from captured sinusodal tracks from Sinasodal Model
sineModel_analysis- Parameters:
- x: 1d array
input signal
- fs: int, scalar
sampling frequency
- winlen: int
analysis window length
- overlap: int,
analysis overlap length
- N: int, default=1,
number of sinusodal tracks to retain
higher the number, more complexity is captured
- thr: scalar, default=-20,
threshold on magnitude spectum, in dB
lower the value, more values are retained
- mag: scalar, default=-1
to enforce the sinusodal wave,
if mag=0 or 1, signal is recostructed from sinusodal tracks, ignoring the original magnitude of track
in case of single track (N=1), recostructed signal will be much like sine wave of varying frequecy but not varying amplitude.
- Other: default
other parameters are from
sineModel_analysis, which have their default values sets(minDur=0.01,freq_devOffset=10,freq_devSlope=0.1,window=’blackmanharris’)
- Returns:
- xr: 1d-array
reconstructed signal
- (fXst, mXst, pXst): output of
sineModel_analysis
See also
dft_analysisDiscreet Fourier Transform - DFT
dft_synthesisInverse Discreet Fourier Transform - iDFT
stft_analysisShort-Time Fourier Transform - STFT
stft_synthesisInverse Short-Time Fourier Transform - iSTFT
frftFractional Frourier Transform - FRFT
ifrftInverse Fractional Frourier Transform - iFRFT
sineModel_analysisSinasodal Model Decomposition
sineModel_synthesisSinasodal Model Synthesis
Notes
#TODO
References
wikipedia -
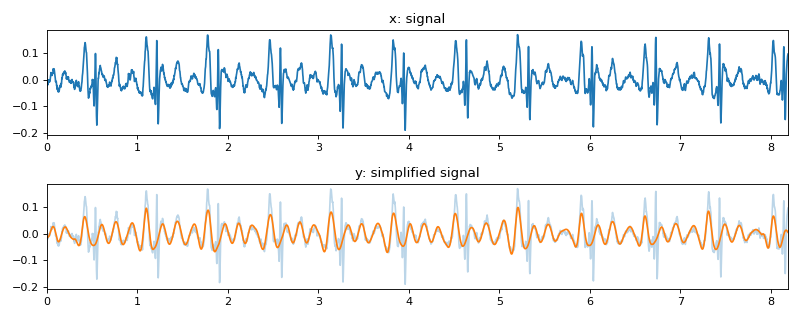
Examples
#sp.simplify_signal
import numpy as np
import matplotlib.pyplot as plt
import spkit as sp
x,fs,lead_names = sp.data.ecg_sample_12leads(sample=2)
x = x[:int(fs*10),5]
x = sp.filterDC_sGolay(x, window_length=fs//3+1)
t = np.arange(len(x))/fs
N = 1
y, (fXst, mXst, pXst) =  sp.simplify_signal(x,fs,winlen=201,overlap=50,mag=-1,N=N,thr=-50,minDur=0.01,
                                            freq_devOffset=10,freq_devSlope=0.1,window='blackmanharris')
plt.figure(figsize=(10,4))
plt.subplot(211)
plt.plot(t,x)
plt.xlim([t[0],t[-1]])
plt.title('x: signal')
plt.subplot(212)
plt.plot(t,x,alpha=0.3)
plt.plot(t,y[:len(t)])
plt.xlim([t[0],t[-1]])
plt.title('y: simplified signal')
plt.tight_layout()
plt.show()