spkit.mea.mea_feature_map
- spkit.mea.mea_feature_map(features, ch_labels, bad_channels=[], fmt='.1f', vmin=None, vmax=None, cmap='jet', label='unit', title='', figsize=None, show=False)
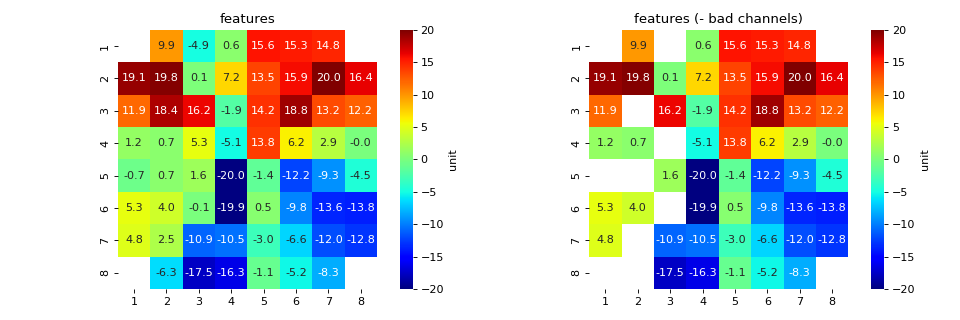
Displaying Feature values of MEA channels in a MEA Grid
Displaying Feature values of MEA channels in a MEA Grid
MEA 8x8 GRID

        | 21 | 31 | 41 | 51 | 61  | 71 |
    |12 | 22 | 32 | 42 | 52 | 62  | 72 | 82 |
    |13 | 23 | 33 | 43 | 53 | 63  | 73 | 83 |
    |14 | 24 | 34 | 44 | 54 | 64  | 74 | 84 |
    |15 | 25 | 35 | 45 | 55 | 65  | 75 | 85 |
    |16 | 26 | 36 | 46 | 56 | 66  | 76 | 86 |
    |17 | 27 | 37 | 47 | 57 | 67  | 77 | 87 |
        | 28 | 38 | 48 | 58 | 68  | 78 |
- Parameters:
- features: list/array
array of a feature for all the channels
e.g len(features) = 60
- ch_labels: list
list of channel labels corresponding to features
same length as number of features
- bad_channels: list
list of Bad channels, values should be inclusive of ch_labels
if passed, two matrix plots are showm, one without excluding bad channels
one by excluding bad channels
- fmt: str,
precision format to show value, default = ‘.1f’, at one decimal point
- (vmin, vmax): default (None, None)
colormap range, default set to (None, None)
- cmap: default=’jet’
colormap,
- label: str
label for colorbar default=’unit’
- title: str,
title of figure default=’’,
- figsize: figure size
- show: bool, deafult=False
if true, plt.show() is executed, with show=False, properties of figure can be changed.
- Returns:
- FxMEA 8x8 Grid
Feature Matrix of feature of each channel arranged in MEA grid form
- Fx_bad: MEA 8x8 Grid
Matrix of ones and NaN each channel arranged in MEA grid form
1 if channel is good
np.nan if channels in BAD, from given list of bad_channels
Fx_bad can be used as by simply multiplying to Fx,
Fxb = Fx*Fx_bad
See also
Examples
#sp.mea.plot_mea_grid
import numpy as np
import matplotlib.pyplot as plt
import spkit as sp

ch_labels = np.array([47, 48, 46, 45, 38, 37, 28, 36, 27, 17, 26, 16, 35, 25, 15, 14, 24,
    34, 13, 23, 12, 22, 33, 21, 32, 31, 44, 43, 41, 42, 52, 51, 53, 54,
    61, 62, 71, 63, 72, 82, 73, 83, 64, 74, 84, 85, 75, 65, 86, 76, 87,
    77, 66, 78, 67, 68, 55, 56, 58, 57])

bad_channels_list = [15,23, 25, 27, 28, 31, 34, 36]

features = sp.create_signal_1d(n=60,seed=1)*20

Fx, Fx_bad = sp.mea.mea_feature_map(features,ch_labels=ch_labels,bad_channels=bad_channels_list,
                                figsize=(12,4),title='features')