spkit.mea.mat_list_show
- spkit.mea.mat_list_show(A, fmt='.1f', vmin=None, vmax=None, cmap='jet', figsize=None, labels=[], titles=[], grid=(2, 2))
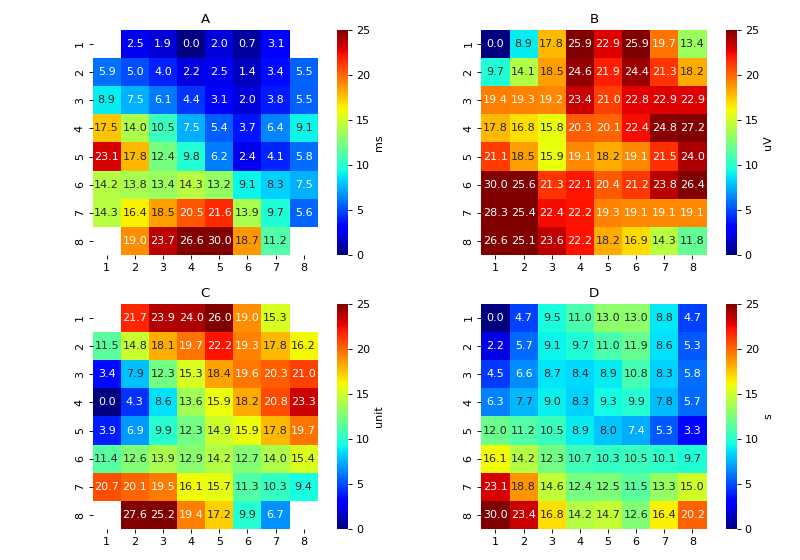
Display multiple Feature Matrix of MEA
Display multiple Feature Matrix of MEA
- Parameters:
- A: list
list of feature matrix Fx, arranged in MEA-grid form
- Following setting is applied to all the plots, for individual limit of colormap use :func:`mat_1_show`
- fmt: str,
precision format to show value, default = ‘.1f’, at one decimal point, same applies to all the matrix plot
- (vmin, vmax):
colormap range, default set to (None, None),
same applies to all the matrix plot
- cmap:str, default=’jet’
colormap
- labels: list of str,
label for each colorbar default=[], an empty list
- titles: list of str,
title for each figure default= [], an empty list
- figsize: figure size
- grid: tuple, (row,col), default = (2,2)
grid as to arraged these feature matrixs
- Returns:
- None
See also
Examples
#sp.mea.mat_1_show
import numpy as np
import matplotlib.pyplot as plt
import spkit as sp

A = []

for i in range(4):
    Ax = (sp.create_signal_2d(n=8,sg_winlen=5, sg_polyorder=1,seed=2+i)*30).round(1)
    if i%2==0:Ax[[0,0,7,7],[0,7,0,7]] = np.nan
    A.append(Ax)

sp.mea.mat_list_show(A,fmt='.1f',vmin=None, vmax=25,cmap='jet',figsize=(10,7),
                    labels=['ms','uV','unit','s'],titles=['A','B','C','D'],grid=(2,2))