spkit.mea.mat_1_show
- spkit.mea.mat_1_show(A, fmt='.1f', vmin=None, vmax=None, cmap='jet', label='', title='', ax=None)
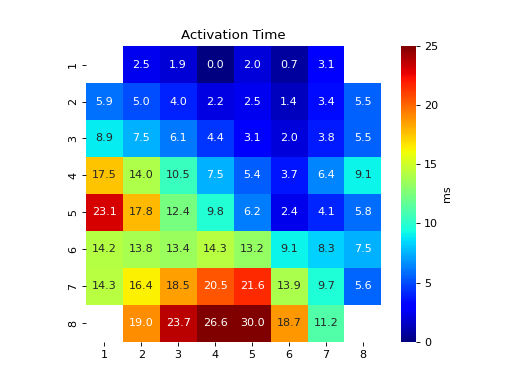
Display a single Feature Matrix of MEA
Display a single Feature Matrix of MEA
Useful to plot multiple matrix with different settings. As no figure is initiated, ‘mat_1_show’ can be followed by subplots
- Parameters:
- A: 2d-array
single feature matrix
- fmt: str,
precision format to show value, default = ‘.1f’, at one decimal point
- (vmin, vmax): default=(None, None)
colormap range,
- cmap: str, matplotlib obj
default=’jet’
- label: str,
label for colorbar default=’unit’
- title: str,
title of figure default=’’,
- Returns:
- axmatplotlib Axes
Axes object with the heatmap.
See also
Examples
#sp.mea.mat_1_show
import numpy as np
import matplotlib.pyplot as plt
import spkit as sp

Ax = (sp.create_signal_2d(n=8,sg_winlen=5, sg_polyorder=1,seed=2)*30).round(1)
Ax[[0,0,7,7],[0,7,0,7]] = np.nan

ax = sp.mea.mat_1_show(Ax,fmt='.1f',vmin=0, vmax=25,cmap='jet',label='ms',title='Activation Time',ax=None)