
Note
Go to the end to download the full example code or to run this example in your browser via JupyterLite or Binder
Entropy - Real-Valued Source
Entropy of real-values source is computed by estimating the probability distribution of the source signal. While doing computing it, entropy value depend a lot on number of bins used to discreetised the signal/source, so to fairly compare two sources, either use normalised entropy or enforce the equal number of bins for both signals/sources
spkit-version 0.0.9.7
Shannan entropy
Entropy of x: H(x) = 4.45836212511516
Entropy of y: H(y) = 5.050864252588681
Normalised Shannan entropy
Entropy of x: H(x) = 0.9997601726826201
Entropy of y: H(y) = 0.8586045779433459
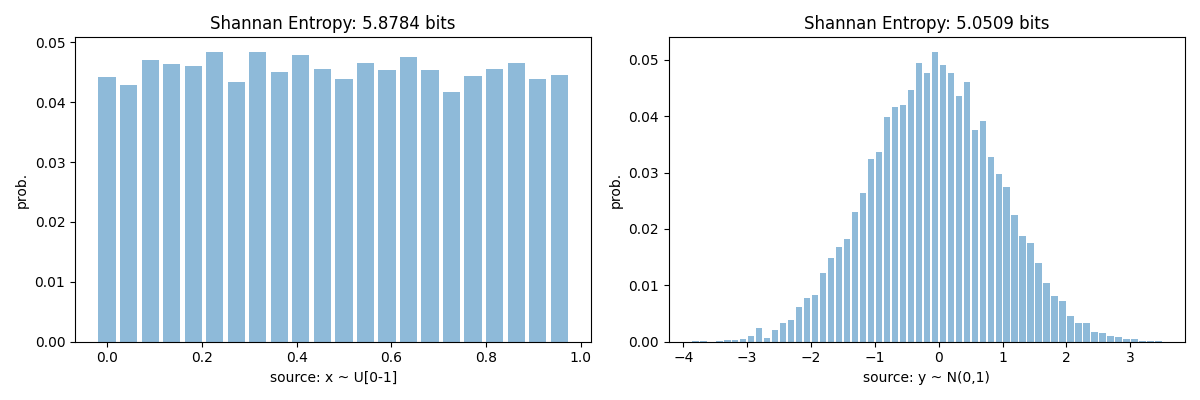
Un-normalised Shannan entropy with same number of bins
Entropy of x: H(x) = 5.878442630682764
Entropy of y: H(y) = 5.050864252588681
Rényi entropy
Entropy of x: H(x) = 5.874297680532265
Entropy of y: H(y) = 4.836835178964307
import numpy as np
import matplotlib.pyplot as plt
import spkit as sp
print('spkit-version',sp.__version__)

x = np.random.rand(10000)
y = np.random.randn(10000)

#Shannan entropy
H_x = sp.entropy(x,alpha=1)
H_y = sp.entropy(y,alpha=1)
print('Shannan entropy')
print('Entropy of x: H(x) = ',H_x)
print('Entropy of y: H(y) = ',H_y)
print('')

# Entropy of real-values source depend a lot on number of bins, so to
# fairly compare two sources, either use normalised entropy or enforce
# the equal number of bins for both sources

Hn_x = sp.entropy(x,alpha=1, normalize=True)
Hn_y = sp.entropy(y,alpha=1, normalize=True)
print('Normalised Shannan entropy')
print('Entropy of x: H(x) = ',Hn_x)
print('Entropy of y: H(y) = ',Hn_y)
print('')

bins = int(max(sp.bin_width(x)[1], sp.bin_width(y)[1]))

Hf_x = sp.entropy(x,alpha=1, bins=bins)
Hf_y = sp.entropy(y,alpha=1, bins=bins)

print('Un-normalised Shannan entropy with same number of bins')
print('Entropy of x: H(x) = ',Hf_x)
print('Entropy of y: H(y) = ',Hf_y)


print('')
#Rényi entropy
Hr_x= sp.entropy(x,alpha=2,bins=bins)
Hr_y= sp.entropy(y,alpha=2,bins=bins)
print('Rényi entropy')
print('Entropy of x: H(x) = ',Hr_x)
print('Entropy of y: H(y) = ',Hr_y)


plt.figure(figsize=(12,4))
plt.subplot(121)
sp.hist_plot(x,show=False,norm=True)
plt.title(f'Shannan Entropy: {Hf_x.round(4)} bits')
plt.xlabel('source: x ~ U[0-1]')
plt.ylabel('prob.')
plt.subplot(122)
sp.hist_plot(y,show=False,norm=True)
plt.title(f'Shannan Entropy: {Hf_y.round(4)} bits')
plt.xlabel('source: y ~ N(0,1)')
plt.ylabel('prob.')
plt.tight_layout()
plt.show()
Total running time of the script: (0 minutes 0.241 seconds)
Related examples
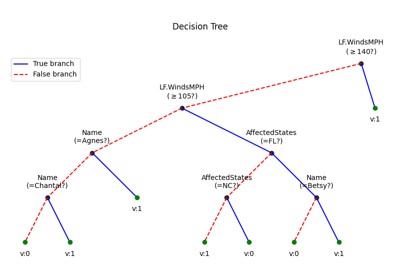
Decision Trees without converting Catogorical Features
Decision Trees without converting Catogorical Features