spkit.hist_plot
- spkit.hist_plot(x, norm=False, bins='fd', show=False)
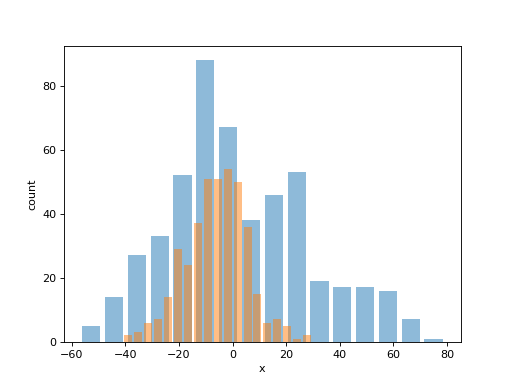
Plot histogram with optimal number of bins (FD).
- Parameters:
- norm: bool - if norm = True, plot is probability disctribution, else frequency
- bins: str, int. if str method to compute number of bins, if int, number of bins
- Returns:
- display: histogram plot
Examples
#sp.hist_plot
import numpy as np
import matplotlib.pyplot as plt
import spkit as sp
X, fs, ch_names = sp.data.eeg_sample_14ch()
x1 = X[:500,0]
sp.hist_plot(x1)
x2 = X[800:1200,0]
sp.hist_plot(x2)
plt.xlabel('x')
plt.ylabel('count')
plt.show()