spkit.data.linear
- spkit.data.linear(N=[100, 100], m='random', b='random', s=0.1, return_para=False, **kwargs)
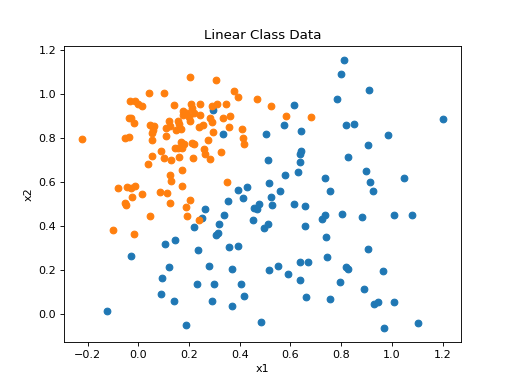
Generate a 2-class dataset separated by a linear boundary
Generating samples using:
\[y = m*x = b \]- Parameters:
- N: list or two int, default =[100,100]
vector that fix the number of samples from each class
example N = [100,100], 100 samples for each class
- m: scalar, str, default=’random’
slope of the separating line.
- b: scalar, str, default=’random’
bias of the line. Default is random.
- s: float,default= 0.1
standard deviation of the gaussian noise. Default is 0.1
New in version 0.0.9.7: Added to return parameters
- return_para: bool, default=False
if True, return the parameters
- Returns:
- X: 2d-array
data matrix with a sample for each row
shape (n, 2)
Changed in version 0.0.9.7: shape is changed to (n, 2)
- y: 1d-array
vector with the labels
Changed in version 0.0.9.7: shape is changed to (n, )
- (m, b, s): parameters
if return_para is True
See also
Examples
#sp.data.linear
import numpy as np
import matplotlib.pyplot as plt
import spkit as sp
np.random.seed(3)
X, y =  sp.data.linear(N =[100, 100],s=0.1)
np.random.seed(None)
plt.figure()
plt.plot(X[y==0,0],X[y==0,1],'o')
plt.plot(X[y==1,0],X[y==1,1],'o')
plt.xlabel('x1')
plt.ylabel('x2')
plt.title('Linear Class Data')
plt.show()