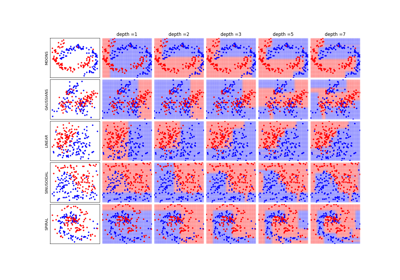
spkit.data.create_dataset
- spkit.data.create_dataset(N=100, Dtype='GAUSSIANS', noise=0, use_preset=False, return_para=False, **kwargs)
Sample a 2D dataset from different distributions
Create 2D dataset for 2-class from different distributions
- Parameters:
- N: int, default=100
Number of total samples, equally divided into two classes
for N=100, there will be 50 in class 0 and 50 in class 1
- Dtype: str, default=’GAUSSIANS’
Type of distribution used.
It must be one from {‘MOONS’ ‘GAUSSIANS’ ‘LINEAR’ ‘SINUSOIDAL’ ‘SPIRAL’}
Or {‘moons’ ‘gaussians’ ‘linear’ ‘sinusoidal’ ‘spiral’}
- noise: scalar [0,1], default=0
probability to have a wrong label in the dataset
noise=0 mean no wrong label
- return_para: bool, default=False
if True, parameters are returned
- Other parameters: **kwargs
Other parameters can be passed, depending on the selected distibution
if not passed, default setting of those parameters are used.
- warn: bool, default=True
To turn off the warning of supplying irrelevent arguments, pass
warn=False.
- 1. ‘GAUSSIANS’ parameters: :func:`gaussian`
- ndist: scalar, default=3
number of gaussian for each class.
- means: array, shape (2*ndist X 2), default=’random’
vector of size(2*ndist X 2) with the means of each gaussian.
- sigmas: array , default=’random’
A sequence of covariance matrices of size (2*ndist, 2)
- 2. MOONS’ parameters: :func:`moons`
- s: scalar, default=0.1
standard deviation of the gaussian noise.
- d: scalar, str, default=’random’
1x2 translation vector between the two classes.
With d = 0 the classes are placed on a circle.
- angle: scalar , default=’random’
rotation angle of the moons (radians)
- 3. ‘LINEAR’ parameters: :func:`linear`
- m: scalar, str, default=’random’
slope of the separating line.
- b: scalar, str, default=’random’
bias of the line. Default is random.
- s: float,default= 0.1
standard deviation of the gaussian noise. Default is 0.1
- 4. ‘SINUSOIDAL’ parameters: :func:`sinusoidal`
- s: scalar, default=0.1
standard deviation of the gaussian noise.
- 5. ‘SPIRAL’ parameters: :func:`spiral`
- s: scalar, default=0.5
standard deviation of the gaussian noise.
- wrappings: scalar, str, default=’random’
number of wrappings of each spiral.
- m: scalar, str, default=’random’
multiplier m of x * sin(m * x) for the second spiral.
- Returns:
- X: 2d-array
data matrix with a sample for each row
shape (n, 2)
- y: 1d-array
vector with the labels
See also
Examples
#sp.data.create_dataset
import numpy as np
import matplotlib.pyplot as plt
import spkit as sp
DTypes = ['moons','gaussian','linear','sinusoidal','spiral']
plt.figure(figsize=(15,3))
for i, dtype in enumerate(DTypes):
    #print(dtype)
    X,y = sp.data.create_dataset(N=200, Dtype=dtype,use_preset=True)
    plt.subplot(1,5,i+1)
    plt.plot(X[y==0,0],X[y==0,1],'o')
    plt.plot(X[y==1,0],X[y==1,1],'o')
    plt.title(f'{dtype}')
plt.tight_layout()
plt.show()


