spkit.clean_phase
- spkit.clean_phase(xp, w=1, thr=-1.5707963267948966, low=-3.141592653589793, high=3.141592653589793)
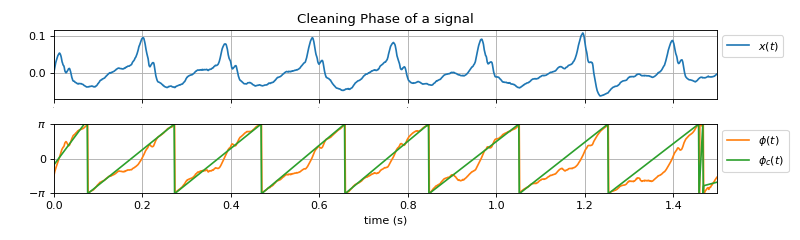
Cleaning Phase
Cleaning phase to capture dominent phase information and removing small flatuations.
- Parameters:
- xp: array, [-pi, pi]
raw instanious phase from signal
- w: float [0,1]
weight for combining original + new cleaned pahse
xpc = (1-w) * xp + w * xp_new
- thr: float, default=-np.pi/2
threshold for detecting phase boundaries.
- (low,high): -np.pi, np.pi
lower and upper value of phase value
- Returns:
- xprcleaned phase
See also
phase_map,dominent_freq,phase_map_reconstruction,dominent_freq_win,amplitude_equalizer
Notes
#TODO
References
wikipedia -
Examples
#sp.clean_phase
import numpy as np
import matplotlib.pyplot as plt
import spkit as sp
x,fs = sp.data.optical_sample(sample=1)
x = x[:int(1.5*fs)]
x = sp.filterDC_sGolay(x,window_length=fs//2+1)
t = np.arange(len(x))/fs
xp = sp.phase_map(x,add_sig=False)
xpc = sp.clean_phase(xp,w=1,thr=-np.pi/2, low=-np.pi, high=np.pi)
plt.figure(figsize=(10,3))
plt.subplot(211)
plt.plot(t,x,label=f'$x(t)$')
plt.grid()
plt.legend(bbox_to_anchor=(1,1))
plt.xlim([t[0],t[-1]])
plt.xticks(fontsize=0)
plt.title('Cleaning Phase of a signal')
plt.subplot(212)
plt.plot(t,xp,color='C1',label=r'$\phi (t)$')
plt.plot(t,xpc,color='C2',label=r'$\phi_c(t)$')
plt.xlim([t[0],t[-1]])
plt.ylim([-np.pi,np.pi])
plt.yticks([-np.pi,0,np.pi],[r'$-\pi$','0',r'$\pi$'])
plt.ylabel('')
plt.xlabel('time (s)')
plt.grid()
plt.legend(bbox_to_anchor=(1,1))
plt.subplots_adjust(hspace=0)
plt.tight_layout()
plt.show()