
Note
Go to the end to download the full example code or to run this example in your browser via JupyterLite or Binder
Testing two groups
#sp.stats.test_2groups
Example 1: Paired
import numpy as np
import matplotlib.pyplot as plt
import spkit as sp
np.random.seed(1)
x1 = np.random.randn(100)
x2 = np.random.randn(100)+0.2
tPass,(df1,df2) = sp.stats.test_2groups(x1,x2,paired=True,alpha=0.05,title=None,tval=True,
                    printthr=1,return_all=True,print_round=4,notes=True,pre_tests=True,effect_size=True,
                    plots=True)


print('Test Result Table')
print(df1)
print('Test Effect-size')
print(df2)
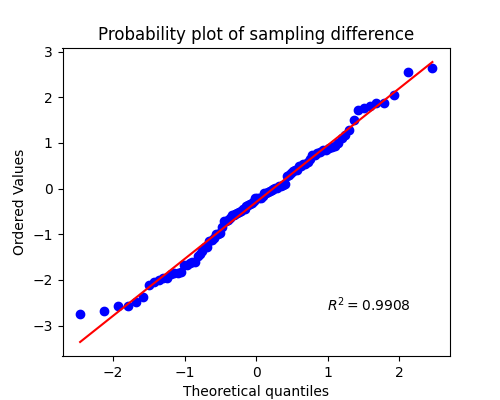
Test for Normality
--------------------------------------------------
Shapiro-test on diff
p-value: 0.408 -  with stats 0.9865     |    Pass
If test is not significant (p<alpha) that indicates the sampling distribution is normally distributed.

Effect Size
--------------------------------------------------
Mean diff (x1-x2):       -0.2922
CohensD   (x1-x2):       -0.3199


==================================================
Final Test
==================================================
Test                        p-value         (stats) |(n=100)
--------------------------------------------------
T-test paired         0.0196          (stats= -2.3719)
Wilcoxon signed-rank  0.028           (stats= 1886.0)
==================================================

Test Result Table
          p-value        stats
shapiro  0.407988     0.986549
t-test   0.019631    -2.371901
wilcox   0.028014  1886.000000
Test Effect-size
             mean_diff   CohensD
effect_size  -0.292212 -0.319897
Example 2: Unpaired
import numpy as np
import matplotlib.pyplot as plt
import spkit as sp
np.random.seed(1)
x1 = np.random.randn(10)
x2 = np.random.randn(11)+0
tPass,(df1,df2) = sp.stats.test_2groups(x1,x2,paired=False,alpha=0.05,title=None,tval=True,
                        printthr=1,return_all=True,
                        print_round=4,notes=True,pre_tests=True,effect_size=True,plots=True)

print('Test Result Table')
print(df1)
print('Test Effect-size')
print(df2)
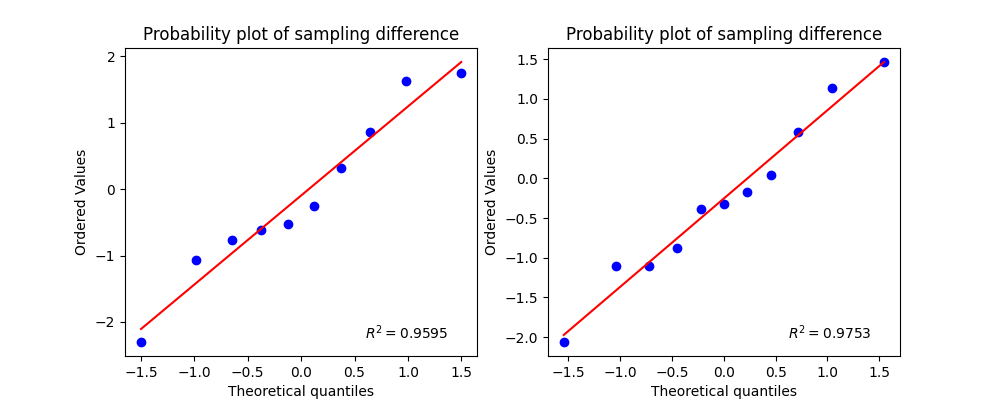
Test for Normality
--------------------------------------------------
Shapiro-test
x1: p-value 0.7441: with stats 0.9564 |   Pass
x2: p-value 0.9299: with stats 0.9747 |   Pass
If test is not significant (p<alpha) that indicates the sampling distribution is normally distributed.

Test for Homogeneity of Variance
--------------------------------------------------
Levene test
p-value 0.5793: with stats 0.3182 | Pass
The small p-value suggests that the populations do not have equal variances

Effect Size
--------------------------------------------------
Mean diff (x1-x2):       0.1571
CohensD   (x1-x2):       0.1371


==================================================
Final Test
==================================================
Test                        p-value         (stats) |(n1=10, n2=11)
--------------------------------------------------
T-test indept.          0.7572          (stats= 0.3137)
Wilcoxon rank-sum       0.7248          (stats= 0.3521)
==================================================

Test Result Table
             p-value     stats
shapiro_x1  0.744053  0.956390
shapiro_x2  0.929865  0.974728
levene      0.579284  0.318210
t-test      0.757153  0.313718
ranksum     0.724771  0.352089
Test Effect-size
             mean_diff   CohensD
effect_size   0.157087  0.137073
Total running time of the script: (0 minutes 0.127 seconds)
Related examples
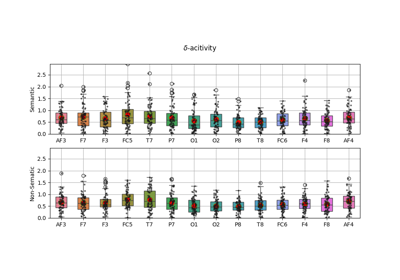
EEG Computing Rhythmic Features - PhyAAt - Semanticity
EEG Computing Rhythmic Features - PhyAAt - Semanticity