spkit.stats.test_2groups
- spkit.stats.test_2groups(x1, x2, paired=True, alpha=0.05, pre_tests=True, effect_size=True, tval=False, notes=True, print_round=4, title=None, printthr=1, plots=True, figsize=(5, 4), return_all=False)
Test two groups
- Parameters:
- x1: 1d-array
- x2: 1d-array
- paired: bool, default=True
if True, x1 and x2 are assumed to be paired, and paired tests are applied
- alpha: scalar [0,1], default=0.05
alpha level,
threshold on p-value for passing/failing declaration
- pre_tests: bool, default=True
if True pre-tests, Shapiro, and Levene results are shown too
Shapiro: Normality
Levene: Homogeneity of Variance only for Unpaired
- effect_size: bool, default=True
To show effect size (mean difference) and Cohen’s D
- tval: bool, default=False
if True, all the statisitics (such as t-stats) are also shown
- notes: bool, defualt=True
to print notes along the pre-tests about interpretation of p-value
- print_round: int, default=4
rounding off all the numbers to decimal points
print_round=4 means upto 4 decimal points
print_round=-1 means all the decimal points available
- title: str, default=None
if passed as str, used as heading with “Final Test”
useful when running many tests
- printthr: scalar [0,1], deafult=1
threhold on p-value to display the results of final test
if p-value of final test is >printthr then ‘final test’ results are not printed
default=1 to always print the results of final test
- plots: bool, default=True
if False then plots are avoided
- figsize: figsize default=(5,4)
for paired, one plot figsize is used as it is.
for unpaired, two plots, width is doubled
- return_all: bool, default=False
if True, two tables of all the results are returned
- Returns:
- tPass: bool
True, if any one of the final test was passed (i.e., p-value < alpha)
False means, none of the final test was passed
- (df_tests, df_esize): pd.DataFrames
df_tests: Table of all the tests
df_esize: table of effect size
See also
Notes
Check example with notebook for better view of the output
References
Student’s t-test : https://en.wikipedia.org/wiki/Student%27s_t-test
Wilcoxon signed-rank test: https://en.wikipedia.org/wiki/Wilcoxon_signed-rank_test
Shapiro–Wilk test: https://en.wikipedia.org/wiki/Shapiro%E2%80%93Wilk_test
Levene’s test: https://en.wikipedia.org/wiki/Levene%27s_test
Effect Size : https://en.wikipedia.org/wiki/Effect_size
Examples
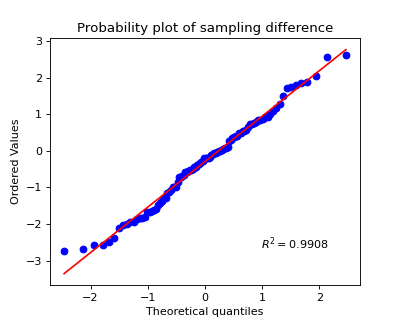
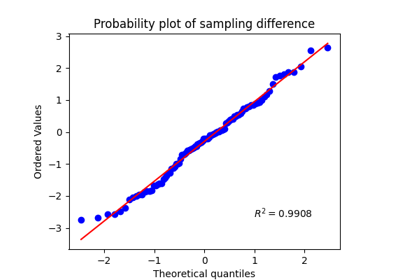
>>> #sp.stats.test_2groups
>>> #Example 1: Paired
>>> import numpy as np
>>> import matplotlib.pyplot as plt
>>> import spkit as sp
>>> np.random.seed(1)
>>> x1 = np.random.randn(100)
>>> x2 = np.random.randn(100)+0.2
>>> tPass,(df1,df2) = sp.stats.test_2groups(x1,x2,paired=True,alpha=0.05,tval=True,return_all=True)
>>> print(df1)
          p-value        stats
shapiro  0.407988     0.986549
t-test   0.019631    -2.371901
wilcox   0.028014  1886.000000
>>> print(df2)
             mean_diff   CohensD
effect_size  -0.292212 -0.319897
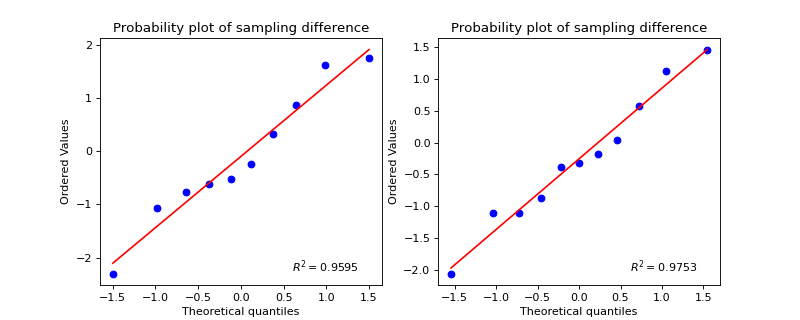
>>> #sp.stats.test_2groups
>>> #Example 2: Unpaired
>>> import numpy as np
>>> import matplotlib.pyplot as plt
>>> import spkit as sp
>>> np.random.seed(1)
>>> x1 = np.random.randn(10)
>>> x2 = np.random.randn(11)+0
>>> tPass,(df1,df2) = sp.stats.test_2groups(x1,x2,paired=False,alpha=0.05,tval=True,return_all=True)
>>> print(df1)
             p-value     stats
shapiro_x1  0.744053  0.956390
shapiro_x2  0.929865  0.974728
levene      0.579284  0.318210
t-test      0.757153  0.313718
ranksum     0.724771  0.352089
>>> print(df2)
             mean_diff   CohensD
effect_size   0.157087  0.137073