spkit.quantize_signal
- spkit.quantize_signal(x, n_levels=None, A=None, Mu=None, cdf_map=False, keep_range=True, bin_method='fd', bin_scale=1, min_levels=2)
Quantize signal into discreet levels
Quantize signal into discreet levels
Before quantization, signal is equalise using either of three methods (1) A-Law, (2) Mu-Law, or (3) Cummulative Distribution Function
- Parameters:
- x: 1d-array, input signal
- n_levels: int, >1, default=None
if None, number of levels are computed based on optimum bin of signal distribuation according to given method (default=’fd’: Freedman–Diaconis rule). While computing, n_levels, following two parameters are effective; bw_scale, min_levels
- if n_levels=None:
- bin_method: str, default=’fd’, {‘fd’,’sqrt’,’sturges’,’rice’,’doane’,’scott’}
Method to compute bin width ‘fd’ (Freedman Diaconis Estimator)
- bin_scale: scaler, +ve, default=1
It is used to scale the bin width computed by Freedman–Diaconis rule. Higher it is less number of levels are estimated
min_levels, int, +ve, default=2, while computing n_levels, ensuring the minimum number of levels
- Distribution Equalization: Only one of following can be applied
- A: int,>0, default=None
if not None, A-Law compading is applied to equalise the distribution
A>0, A=1, means identity funtion
- Mu: int,>=0, default=None
if not None, Mu-Law compading is applied to equalise the distribution
Mu>=0, Mu=0 mean identity funtion
- cdf_map: bool, default=False
If true, CDF mapping is applied to equalise the distribution
- keep_range: bool, default=True
If True, return quantized signal is rescaled to its original range, else returned signal is in range of 0 to 1
- Returns:
- y: Quantized signal, same size as x
if keep_range=True, y has same range as x, else 0 to 1
- y_int: Quantized signal as integer level, ranges from 0 to n_levels-1
Useful to map signal in post-processing
See also
cdf_mappingCDF Mapping
A_lawA - Law, Nonlinear mapping
Mu_lawMu - Law, Nonlinear mapping
References
wikipedia
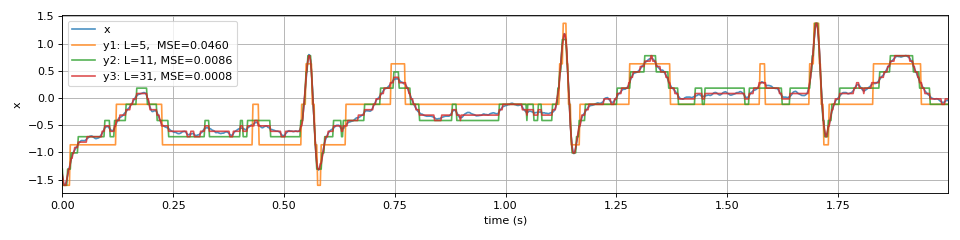
Examples
import numpy as np
import matplotlib.pyplot as plt
import spkit as sp
x,fs,_ = sp.data.ecg_sample_12leads(sample=3)
x = x[:1000,0]
t = np.arange(len(x))/fs
y1, yint = sp.quantize_signal(x.copy(),n_levels=5)
y2, yint = sp.quantize_signal(x.copy(),n_levels=11)
y3, yint = sp.quantize_signal(x.copy(),n_levels=31)
m1 = np.mean((x-y1)**2)
m2 = np.mean((x-y2)**2)
m3 = np.mean((x-y3)**2)
plt.figure(figsize=(12,3))
plt.plot(t,x,alpha=0.8 ,label='x')
plt.plot(t,y1,alpha=0.8,label=f'y1: L=5,  MSE={m1:,.4f}')
plt.plot(t,y2,alpha=0.8,label=f'y2: L=11, MSE={m2:,.4f}')
plt.plot(t,y3,alpha=0.8,label=f'y3: L=31, MSE={m3:,.4f}')
plt.xlim([t[0],t[-1]])
plt.xlabel('time (s)')
plt.ylabel('x')
plt.legend()
plt.grid()
plt.tight_layout()
plt.show()