spkit.cdf_mapping
- spkit.cdf_mapping(x)
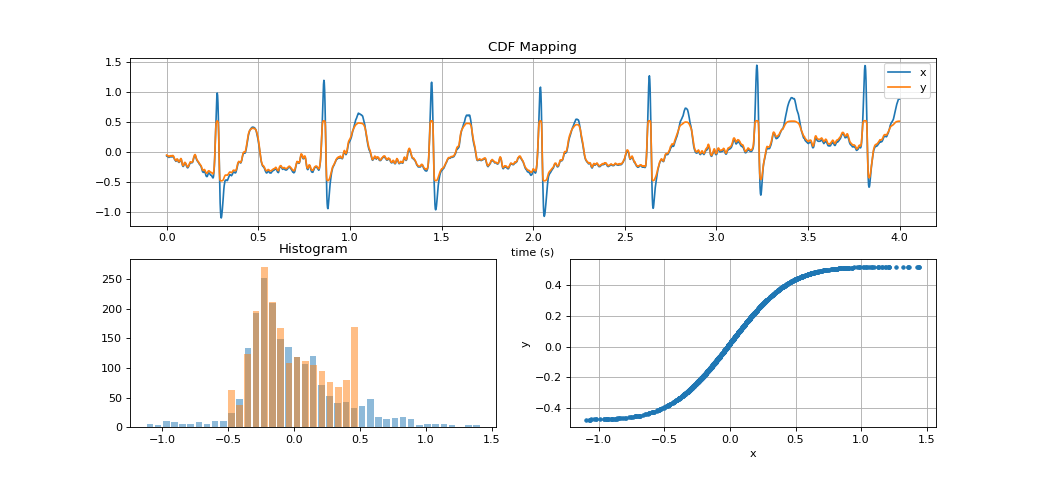
CDF: Cumulative Distribution Function Mapping (Non-linear mapping)
Map the signal x to y from into CDF of x, y will be uniformly disctribuated anf ranges from 0 to 1. CDF: Cumulative Distribution Function
\[y(n) = P(X<=x(n))\]- Parameters:
- x1d-array of shape=(n,)
- Returns:
- x_cdf: cumulative distribution function of x
See also
low_resolutionreducing the resolution of signal
Notes
CDF Mapping shift the mean of the signal and the range.
References
Examples
#sp.cdf_mapping
import numpy as np
import matplotlib.pyplot as plt
import spkit as sp
x,fs,_ = sp.data.ecg_sample_12leads(sample=3)
x = x[1000:3000,0]
x = x - np.mean(x)
t = np.arange(len(x))/fs
y = sp.cdf_mapping(x)
y = y - np.mean(y)
plt.figure(figsize=(13,6))
plt.subplot(211)
plt.plot(t,x,label=f'x')
plt.plot(t,y,label=f'y')
plt.xlabel('time (s)')
plt.legend()
plt.title('CDF Mapping')
plt.grid()
plt.subplot(223)
sp.hist_plot(x)
sp.hist_plot(y)
plt.title('Histogram')
plt.subplot(224)
plt.plot(x,y,'.')
plt.xlabel('x')
plt.ylabel('y')
plt.grid()
plt.show()