spkit.low_resolution
- spkit.low_resolution(x, scale)
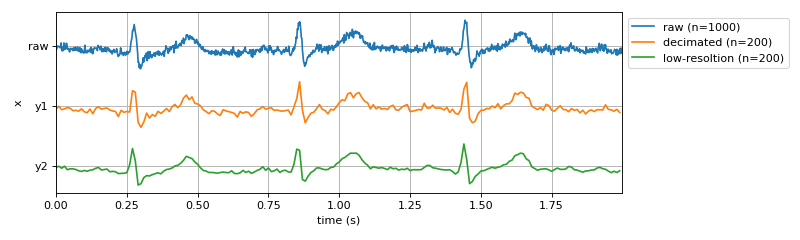
Reducing the time-resolution of signal \(x\)
Reducing the time-resolution of signal : x. It is similar as downsampling (or decimation) of a signal, except it is averaged around removed samples.
- Parameters:
- x1d-array of shape=(n,)
- scale: (int) downsampled by factor of scale and averaged around removed samples
- Returns:
- x_low: shape=(n/scale,) low resolution signal
See also
cdf_mapping# CDF Mapping
Examples
import numpy as np
import matplotlib.pyplot as plt
import spkit as sp
x,fs,_ = sp.data.ecg_sample_12leads(sample=3)
x = x[1000:2000,0]
x = x + 0.1*np.random.randn(len(x))
t = np.arange(len(x))/fs
N = 5
y1 = x[::N] # decimation by factor of N
y2 = sp.low_resolution(x.copy(),scale=N)
t1 = t[::N]
print(y1.shape, y2.shape, x.shape)
plt.figure(figsize=(10,3))
plt.plot(t,x,label=f'raw (n={len(x)})')
plt.plot(t1,y1 - 3,label=f'decimated (n={len(y1)})')
plt.plot(t1,y2 - 6,label=f'low-resoltion (n={len(y2)})')
plt.xlim([t[0],t[-1]])
plt.xlabel('time (s)')
plt.ylabel('x')
plt.yticks([0,-3,-6],['raw','y1','y2'])
plt.legend(bbox_to_anchor=(1,1))
plt.grid()
plt.tight_layout()
plt.show()