spkit.mea.get_stim_loc
- spkit.mea.get_stim_loc(X, fs=25000, ch=0, fhz=1, N=None, method='max_dvdt', gradient_method='fdiff', plot=1, verbose=False, figsize=(15, 3), sg_window=11, sg_polyorder=3, gauss_window=0, gauss_itr=1)
Get Stimulus Locations in given multi-channel
Get Stimulus Locations in given multi-channel X (nch,n)
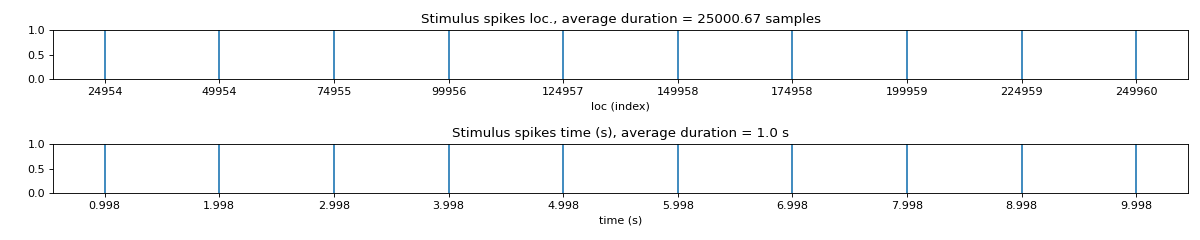
loc: location of stim
    loc = max-dv/dt

                  loc
                   |        +ve peak of stim
                   |-------|
                   |       |
                   |       |
                   |       |
        ---|-------|-------|---------
           |       |
           |       |
           |       |
           |-------|

-ve peak of stim
This function uses
spkit.get_activation_timefunction to identify the locations of stimulation. Checkhelp(sp.get_activation_time)for more details.- Parameters:
- Xnd-array
with shape = (nch,n), where nch: number of channels, n: number of samples,
multi-channel signal recording
- fs: int, default=25000 (25KHz) for MEA
sampling frequency of signal,
- ch: int, default=0
channel number of extract stimlus locations,
- fhz: int, float,
frequency of stimulus, e.g. fhz=1 means 1 stimulus per second
- Nint, default=None,
Number of stimulus to be extracted
if None, N = number_samples/fs/fhz
- method: str, default = ‘max_dvdt’
One of {‘max_dvdt’, ‘min_dvdt’, ‘abs_dvdt’},
Method to locate stimulus, could be one of {‘max_dvdt’, ‘min_dvdt’, ‘abs_dvdt’}
For MEA, max_dvdt - maximum gradient works well, which is a middle transition of stimulus from negative to positive.
Check above illustration.
- gradient_method: str,default=’fdiff’
one of {“fdiff”, “fgrad”, “npdiff”,”sgdiff”,”sgdrift_diff”,”sgsmooth_diff”, “gauss_diff”}
method to compute gradient of signal
for MEA, stim location, ‘fdiff’ works well.
For more details,
spkit.signal_diff
- plot: int, default=1
if 0, no plot are shown,
if 1, final locations of stimulus are plotted
if 2, plot of each stimulus with signal are shown, N-plots are shown
- verbose:bool, default=False,
if False, no information is printed, default if False
- figsize: default=(15,3)
figure size for final figure (if plot>0)
- other parameters:
- (sg_window, sg_polyorder, gauss_window, gauss_itr)parameters for gradient
default (sg_window=11,sg_polyorder=3,gauss_window=0,gauss_itr=1)
these parameters are used while gradient computation, only
if gradient method is one of (“sgdiff”,”sgdrift_diff”,”sgsmooth_diff”, “gauss_diff)
For more details:
spkit.signal_diff
- Returns:
- stim_loc: array of loc
array of locations (as index) of all the stimuli
- stim_mag: array of mag
magnitude of deflection, at stim locatio. It can be used to determine the False Positive
See also
Notes
Sometimes stimuli are on the edge of the cycle duration, try testing or cropping first quarter of the cycle.
Examples
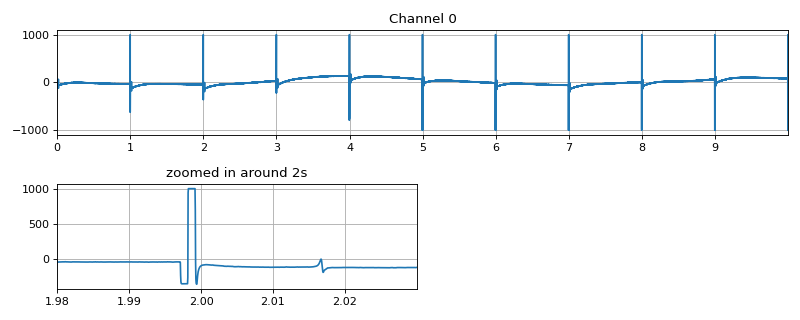
#sp.mea.get_stim_loc
import numpy as np
import matplotlib.pyplot as plt
import os, requests
import spkit as sp

# Download Sample file if not done already
file_name= 'MEA_Sample_North_1000mV_1Hz.h5'

if not(os.path.exists(file_name)):
    path = 'https://spkit.github.io/data_samples/files/MEA_Sample_North_1000mV_1Hz.h5'
    req = requests.get(path)
    with open(file_name, 'wb') as f:
            f.write(req.content)

##############################
# Step 1: Read File
fs = 25000
X,fs,ch_labels = sp.io.read_hdf(file_name,fs=fs,verbose=1)

x = X[0]
t = np.arange(len(x))/fs
t1,t2 = int(fs*1.98), int(fs*2.03)

plt.figure(figsize=(10,4))
plt.subplot(211)
plt.plot(t,x)
plt.xlim([t[0],t[-1]])
plt.xticks(np.arange(len(x)/fs))
plt.grid()
plt.title('Channel 0')
plt.subplot(223)
plt.plot(t[t1:t2],x[t1:t2])
plt.xlim([t[t1],t[t2]])
plt.grid()
plt.title('zoomed in around 2s')
plt.tight_layout()
plt.show()
##############################
# Step 2: Stim Localisation
stim_fhz = 1

stim_loc,_  = sp.mea.get_stim_loc(X,fs=fs,fhz=stim_fhz, plot=1,verbose=1,N=None)