spkit.mea.extract_egm
- spkit.mea.extract_egm(X, act_loc, fs=25000, dur_from_loc=5, remove_drift=True, apply_after=True, sg_window=501, sg_polyorder=2, pad=nan, verbose=False, plot=False, plot_tOffset=True, egm_numbers=[], figsize=(8, 3))
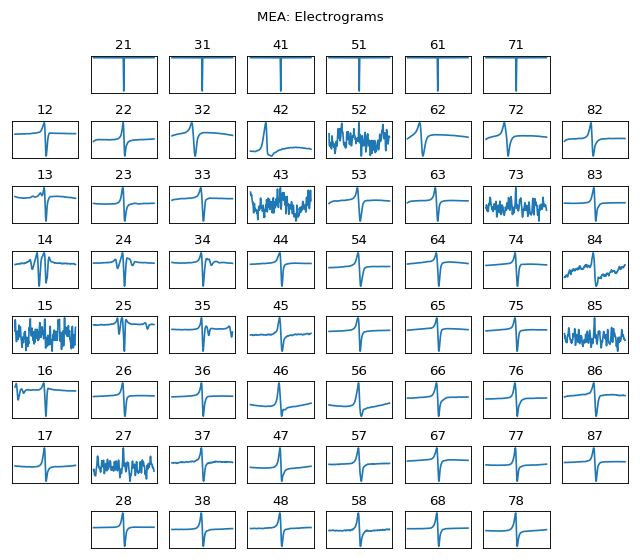
Extract EGMs (Electrograms) from each channel
Extract EGMs (Electrograms) from each channel
Given a m-channels of a single cycle and Activation Time. EGM are extracted from each channel
d =  dur_from_loc

        -------|----------|-----------|---------
             loc-d       loc        loc+d

               |______________________|
                        EGM
- Parameters:
- X: (nch,n), SINGLE CYLCLE
nch = number of channels, n=number of samples of a SINGLE CYLCLE
axis=0 is a channel. Each channel should have single stimulus location, which is given as a list of act_loc
- fsint, default=25000
sampling frequency,
- act_loc:
list of activation time location as index, corresponding to each channel.
Each channel should have single stimulus.
- dur_from_loc: scalar
duration (ms) of signal extracted from each side of location,
extracted signal - EGM would be 2*dur_from_loc ms duration
- remove_drift: bool, default=True,
If True, Savitzky-Golay filter is applied to remove the drift
- apply_after: bool, default=True,
If True, Savitzky-Golay filter to remove drift is applied after extracting EGM
Else drift is removed from entire signal and EGM is extracted
- Parameters for Savitzky-Golay filter
: sg_window=91,sg_polyorder=1 : keep the window size large enough and polyorder low enough to remove only drift
Note
Parameters of Savitzky-Golay filter should be choosen appropriately, which depends if it is applied before or after extracting EGM. In case of after EGM extraction, signal is a small length, so need to adjust sg_window accordingly
- pad: default=np.nan
To pad values to EGM, in case is to shorter than others.
Padding is done to make all EGMs of same shape-nd-array
- plot: bool, default False
If True, two figures per channel are plotted
Figure 1 shows, a raw EGM, computed drift and corrected EGM
Figure 2 shows, Only corrected EGM with loc
- plot_tOffset: bool, deafult=True
If True, absolute time of EGM is shown on x-axis, as shifted to 0 -to -2*dur_from_loc is shown
Displaying absolute time is useful to analyse the locations
- egm_numbers: list, default=[]
index of the egm to plot, if plot is True
if egm_numbers empty list, all the egms are ploted else the one in the list.
- figsize=(8,3):
size of figure
- verbose: bool, default=False
If True, intermediate computations are printed,
- Returns:
- XEAll Exctracted EGMs as nd-array of shape (nch, n)
n = 2*dur_from_loc*fs/1000
- ATloclist of relative activation loc, corresponds to XE
See also
Examples
#sp.mea.extract_egm
import numpy as np
import matplotlib.pyplot as plt
import os, requests
import spkit as sp

# Download Sample file if not done already

file_name= 'MEA_Sample_North_1000mV_1Hz.h5'

if not(os.path.exists(file_name)):
    path = 'https://spkit.github.io/data_samples/files/MEA_Sample_North_1000mV_1Hz.h5'
    req = requests.get(path)
    with open(file_name, 'wb') as f:
            f.write(req.content)

##############################
# Step 1: Read File
fs = 25000
X,fs,ch_labels = sp.io.read_hdf(file_name,fs=fs,verbose=1)

##############################
# Step 2: Stim Localisation
stim_fhz = 1
stim_loc,_  = sp.mea.get_stim_loc(X,fs=fs,fhz=stim_fhz, plot=0,verbose=0,N=None)

##############################
# Step 3: Align Cycles

exclude_first_dur=2
dur_after_spike=500
exclude_last_cycle=True

XB = sp.mea.align_cycles(X,stim_loc,fs=fs, exclude_first_dur=exclude_first_dur,dur_after_spike=dur_after_spike,
                        exclude_last_cycle=exclude_last_cycle,pad=np.nan,verbose=True)

print('Number of EGMs/Cycles per channel =',XB.shape[2])

##############################
# Step 4: Average Cycles or Select one

egm_number = -1

if egm_number<0:
    X1B = np.nanmean(XB,axis=2)
    print(' -- Averaged All EGM')
else:
    # egm_number should be between from 0 to 'Number of EGMs/Cycles per channel '
    assert egm_number in list(range(XB.shape[2]))
    X1B = XB[:,:,egm_number]
    print(' -- Selected EGM ->',egm_number)

print('EGM Shape : ',X1B.shape)

##############################
# Step 5: Activation Time

at_range = [0, 100]

at_loc = sp.mea.activation_time_loc(X1B,fs=fs,t_range=at_range,plot=0)

# Step 6: Repolarisation Time
# Step 7: APD Computation

##############################
# Step 8: Extract EGM

dur_from_loc = 5
remove_drift = True

XE, ATloc = sp.mea.extract_egm(X1B,act_loc=at_loc,fs=fs,dur_from_loc=dur_from_loc,remove_drift=remove_drift)
XE.shape, ATloc.shape

sp.mea.plot_mea_grid(XE,ch_labels=ch_labels,figsize=(8,7),verbose=0,show=False,title_style=1)
plt.suptitle('MEA: Electrograms')
plt.show()