spkit.mea.align_cycles
- spkit.mea.align_cycles(X, stim_loc, fs=25000, exclude_first_dur=1, dur_after_spike=500, exclude_last_cycle=True, pad=nan, verbose=False, **kwargs)
Align Cycles
Align Cycles
Aligning all the cycles with stimulus location.
- Parameters:
- Xnd-array
with shape = (nch,n), where nch: number of channels, n: number of samples,
multi-channel signal recording
- fs: int, default=25000 (25KHz) for MEA
sampling frequency of signal,
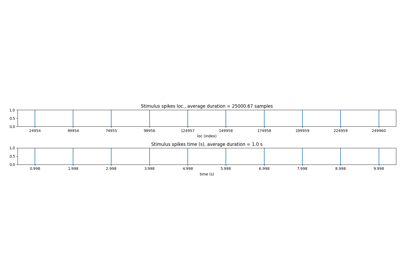
- stim_loc: list or array
list of locations (indexes) of stimuli
computed using
get_stim_loc
- exclude_first_durfloat, default=1
Exclude the duration (in ms) of signal after stimulus spike loc, default 1 ms
It depends on the method of finding stim loc, since stim is 1ms -ve, 1ms +v, and loc is
detected as middle transaction (max_dvdt), atleast 1ms of duration should be excluded.
- dur_after_spike: float, int, defult=500,
Extract the duration (in ms) after stimulus spike to search for EGM
Default 500 ms, good for 1Hz stimuli cycle
- exclude_last_cycle: bool, default = True
if True, last cycle is excluded in aligned cycles. Usually, a good idea to exclude,
since last cylce might have a very small number of samples after spike.
- pad: scalar, default = np.nan
- In case of any cycle being shorter than other (usually last cycle),
padding values to make all cycles in equal size
good to use nan, to avoid using those padded values.
- verbose: bool, default=False
print information, if True.
- Returns:
- XB: Aligned Cycles is shape of (n_ch, n_samples, n_cycles)
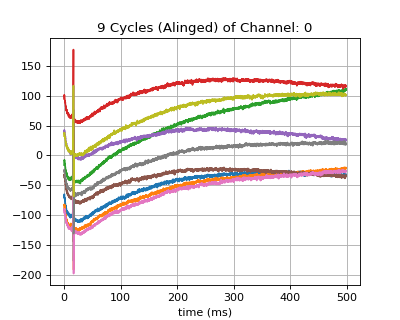
Examples
#sp.mea.align_cycles
import numpy as np
import matplotlib.pyplot as plt
import os, requests
import spkit as sp

# Download Sample file if not done already

file_name= 'MEA_Sample_North_1000mV_1Hz.h5'

if not(os.path.exists(file_name)):
    path = 'https://spkit.github.io/data_samples/files/MEA_Sample_North_1000mV_1Hz.h5'
    req = requests.get(path)
    with open(file_name, 'wb') as f:
            f.write(req.content)

##############################
# Step 1: Read File
fs = 25000
X,fs,ch_labels = sp.io.read_hdf(file_name,fs=fs,verbose=1)

##############################
# Step 2: Stim Localisation
stim_fhz = 1
stim_loc,_  = sp.mea.get_stim_loc(X,fs=fs,fhz=stim_fhz, plot=0,verbose=0,N=None)

##############################
# Step 3: Align Cycles

exclude_first_dur=2
dur_after_spike=500
exclude_last_cycle=True

XB = sp.mea.align_cycles(X,stim_loc,fs=fs, exclude_first_dur=exclude_first_dur,dur_after_spike=dur_after_spike,
                        exclude_last_cycle=exclude_last_cycle,pad=np.nan,verbose=True)

print('Number of EGMs/Cycles per channel =',XB.shape[2])
ch = 0
t = 1000*np.arange(XB.shape[1])/fs
plt.figure(figsize=(5,4))
plt.plot(t,XB[ch,:,:])
plt.grid()
plt.title(f'{XB.shape[2]} Cycles (Alinged) of Channel: {ch}')
plt.xlabel('time (ms)')
plt.show()