spkit.get_repolarisation_time
- spkit.get_repolarisation_time(x, fs, at_loc, t_range=[0.5, 20], method='min_dvdt', gradient_method='fdiff', sg_window=11, sg_polyorder=3, gauss_window=0, gauss_itr=1, verbose=False, **kwargs)
Get Repolarisation Time based on Gradient
Get Repolarisation Time based on Gradient
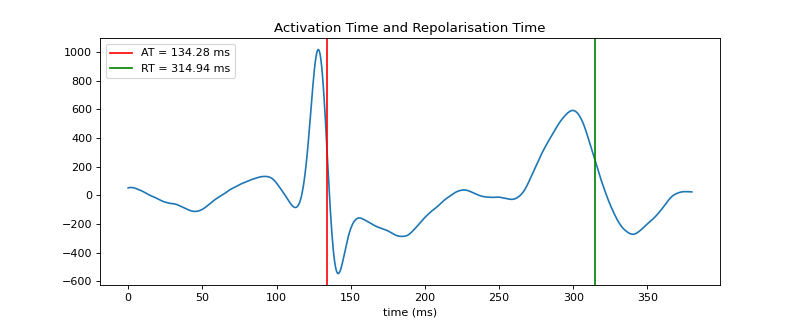
In contrast to ‘Activation Time’ in cardiac electrograms, Repolarisation Time, also refered as Recovery Time, indicates a time at which repolarisation of cells/tissues/heart occures.
Repolarisation time in signal is again a reflected by maximum deflection (mostly negative), after activation occures. That is equal to min-dvdt, after activation time, if signal is a volatge signal and function of time x = v(t)
However, Repolarisation Time is very hard to detect reliably, due to very small electrogram, which is mostly lost in noise.
- Parameters:
- x: 1d-array,
input signal
- fs: int,
sampling frequency
- at_loc: int,
location (index) of activation time, this is used to avoid any deflections before at_loc
- t_range: list of [t0 (ms),t1 (ms)]
range of time to restrict the search of repolarisation time.
Search start from (1000*at_loc/fs + t0) to (1000*at_loc/fs + t1) ms of given signal
- during t0 ms to t1 ms
if t_range=[None,None], whole input signal after at_loc is considered for search
if t_range=[t0,None], excluding signal before 1000*at_loc/fs + t0 ms
if t_range=[None,t1], limiting search to 1000*at_loc/fs to t1 ms
Note
- NOTE: It is recommonded to add a small time gap after at_loc, t_range = [0.5, None] or [1, None]
As next max deflection is almost always very near (within a few sample) to at_loc, which will leads to rt_loc very close to at_loc
- methoddefault = “min_dvdt”
Method to compute Repolarisation Time, “min_dvdt” is the used in literature, however, it depends on the kind of signal.
Some literation suggests to use max_dvdt instead of min_dvdt, but mostly agree on min_dvdt.
There is Wyatt method and Alternative method, suggest diffrent location points as repolarisation time.
It can be chosen one of {“max_dvdt”, “min_dvdt”, “max_abs_dvdt”},
- gradient_method: default =”fdiff”, {“fdiff”, “fgrad”,”sgdiff”,”sgdrift_diff”,”sgsmooth_diff”, “gauss_diff”}
Method to compute gradient of signal
One of {“fdiff”, “fgrad”, “npdiff”,”sgdiff”,”sgdrift_diff”,”sgsmooth_diff”, “gauss_diff”}
Check
signal_difffor more details on the methodIf signal is noisy try “sgsmooth_diff” or “gauss_diff”
- Parameters for gradient_method:
used if gradient_method in one of (“sgdiff”,”sgdrift_diff”,”sgsmooth_diff”, “gauss_diff”)
sg_window: sgolay-filter’s window length
sg_polyorder: sgolay-filter’s polynomial order
gauss_window: window size of gaussian kernel for smoothing,
check
signal_difffor more details on the method
- Returns:
- rtactivation time (ms)
- loc: index
- mag: magnitude of deflection
- dxderivative of signal x
Notes
#TODO
References
Examples
#sp.get_repolarisation_time
import numpy as np
import matplotlib.pyplot as plt
import spkit as sp
x, fs = sp.data.ecg_sample(sample=1)
x = sp.filterDC_sGolay(x,window_length=fs//2+1)
x = sp.filter_smooth_gauss(x,window_length=31)
x = x[int(0.02*fs):int(0.4*fs)]
t = 1000*np.arange(len(x))/fs
at,loc,mag,dx= sp.get_activation_time(x,fs=fs,method='min_dvdt',gradient_method='fdiff')
rt,loc,mag, dx = sp.get_repolarisation_time(x,fs,at_loc=loc,t_range=[50,None],method='min_dvdt',gradient_method='fdiff')

plt.figure(figsize=(10,4))
plt.plot(t,x)
plt.axvline(at,color='r',label=f'AT = {at:0.2f} ms')
plt.axvline(rt,color='g',label=f'RT = {rt:0.2f} ms')
plt.legend()
plt.xlabel('time (ms)')
plt.title('Activation Time and Repolarisation Time')
plt.show()