spkit.data.optical_sample
- spkit.data.optical_sample(sample=1, species=None)
Load sample(s) of optical mapping signals
- Parameters:
- sampleint, {1,2,3,-1}
sample number
if -1, return all three samples
- species: str, default=None, {None, ‘rabbit’}
data of species
for ‘rabbit’, data of two cameras
- Returns:
- Xarray,
shape (n,) or (n,3) if species= None
shape (n,2) or shape (n,6) for species=’rabbit’,
- fsint
See also
eda_sampleElectrodermal activity (EDA)
gsr_sampleGalvanic Skin Response (GSR)
eeg_sample_14chElectroencephalography (EEG) - 14-channel
eeg_sample_1chElectroencephalography (EEG) - 1-channel
eeg_sample_artifactElectroencephalography (EEG) processed
ecg_sample_12leadsElectrocardiogram (ECG) - 12-leads
ecg_sampleElectrocardiogram (ECG) - 1-lead
ppg_samplePhotoplethysmogram (PPG)
egm_sampleElectrogram (EGM)
Examples
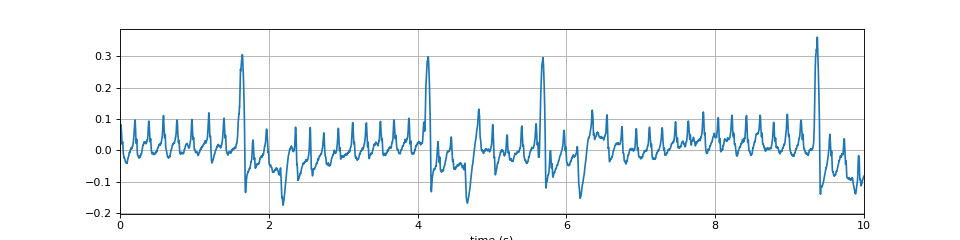
import numpy as np
import matplotlib.pyplot as plt
import spkit as sp
x,fs = sp.data.optical_sample(sample=1)
t = np.arange(len(x))/fs
plt.figure(figsize=(12,3))
plt.plot(t,x)
plt.xlim([t[0],t[-1]])
plt.xlabel('time (s)')
plt.grid()
plt.show()
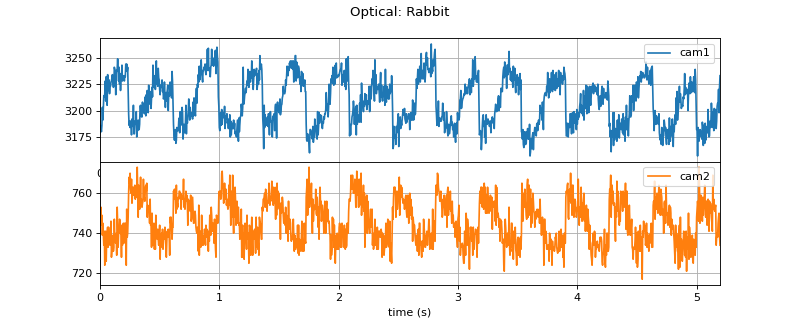
#sp.data.optical_sample
import numpy as np
import matplotlib.pyplot as plt
import spkit as sp
X,fs = sp.data.optical_sample(sample=1,species='rabbit')
t = np.arange(X.shape[0])/fs
plt.figure(figsize=(10,4))
plt.subplot(211)
plt.plot(t,X[:,0],color='C0',label='cam1')
plt.xlim([t[0],t[-1]])
plt.grid()
plt.legend(loc=1)
plt.subplot(212)
plt.plot(t,X[:,1],color='C1',label='cam2')
plt.xlim([t[0],t[-1]])
plt.grid()
plt.legend(loc=1)
plt.xlabel('time (s)')
plt.subplots_adjust(hspace=0)
plt.suptitle('Optical: Rabbit')
plt.show()