spkit.data.eeg_sample_artifact
- spkit.data.eeg_sample_artifact(fname='EEG16sec_artifact.pkl')
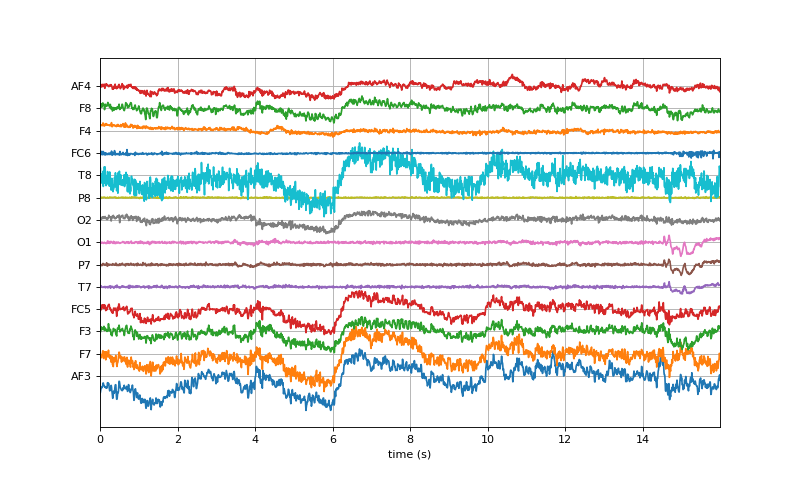
Load 14 channel EEG sample recording of 16 second duration with artifacts and processed.
Recorded sample is a part of PhyAAt Dataset[1]
- Returns:
- datadictionary contants signals with following keys
- ‘X_raw’Raw EEG signal
‘X_fil’ : Raw EEG Filtered with high pass filter (0.5Hz) ‘X_ica’ : Aftifact removed using ICA ‘X_atar_soft’ : artifact removed using ATAR soft thresholding mode ‘X_atar_elim’ : artifact removed using ATAR elimination mode
‘fs’ : sampling frequency ‘info’ : information ‘ch_names’ : channel names
See also
eda_sampleElectrodermal activity (EDA)
gsr_sampleGalvanic Skin Response (GSR)
eeg_sample_14chElectroencephalography (EEG) - 14-channel
eeg_sample_1chElectroencephalography (EEG) - 1-channel
ecg_sample_12leadsElectrocardiogram (ECG) - 12-leads
ecg_sampleElectrocardiogram (ECG) - 1-lead
optical_sampleOptical Mapped Signal
ppg_samplePhotoplethysmogram (PPG)
egm_sampleElectrogram (EGM)
References
[1] PhyAAt Dataset - https://phyaat.github.io/
Examples
import numpy as np
import matplotlib.pyplot as plt
import spkit as sp
data = sp.data.eeg_sample_artifact()
X = data['X_raw']
fs = data['fs']
ch_names = data['ch_names']
t = np.arange(X.shape[0])/fs
sep = 50
plt.figure(figsize=(10,6))
plt.plot(t,X + np.arange(X.shape[1])*sep)
plt.xlim([t[0],t[-1]])
plt.xlabel('time (s)')
plt.yticks(np.arange(X.shape[1])*sep,ch_names)
plt.grid()
plt.show()