spkit.data.egm_sample
- spkit.data.egm_sample(sample=1)
Load sample(s) of Electrograms and ECG
- EGM: Contact Electrical Activity (Physiological Signal)
Sample of 5 signals
- Parameters:
- sampleint, {1,2,3,4,5,-1}
sample number
if -1, return all 5 samples
- Returns:
- Xarray, (n,) or (n,5)
- fsint
See also
eda_sampleElectrodermal activity (EDA)
gsr_sampleGalvanic Skin Response (GSR)
eeg_sample_14chElectroencephalography (EEG) - 14-channel
eeg_sample_1chElectroencephalography (EEG) - 1-channel
eeg_sample_artifactElectroencephalography (EEG) processed
ecg_sample_12leadsElectrocardiogram (ECG) - 12-leads
ecg_sampleElectrocardiogram (ECG) - 1-lead
optical_sampleOptical Mapped Signal
ppg_samplePhotoplethysmogram (PPG)
Examples
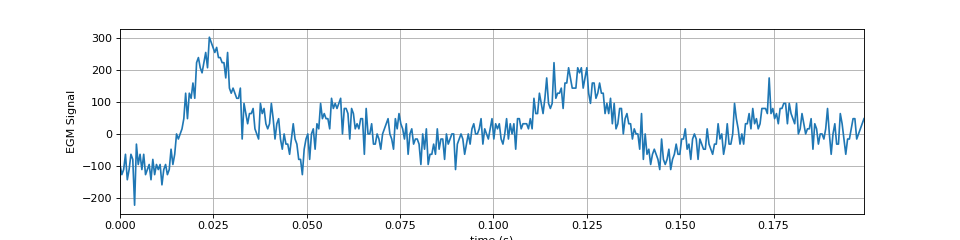
#sp.data.ecg_sample
#Example 1
import numpy as np
import matplotlib.pyplot as plt
import spkit as sp
x,fs = sp.data.egm_sample(sample=1)
x = x[:int(fs*0.2)]
t = np.arange(len(x))/fs
plt.figure(figsize=(12,3))
plt.plot(t,x)
plt.xlim([t[0],t[-1]])
plt.xlabel('time (s)')
plt.ylabel('EGM Signal')
plt.grid()
plt.show()
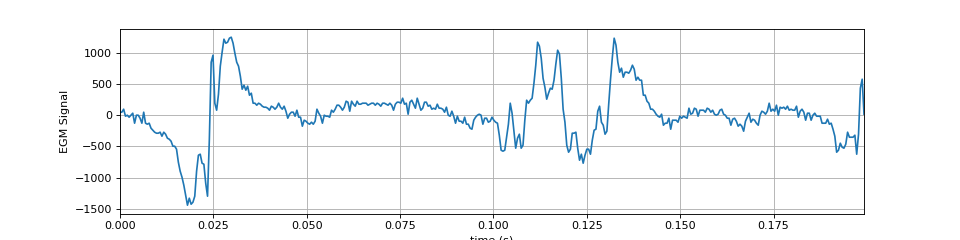
############################
#sp.data.ecg_sample
#Example 2
import numpy as np
import matplotlib.pyplot as plt
import spkit as sp
x,fs = sp.data.egm_sample(sample=2)
x = x[:int(fs*0.2)]
t = np.arange(len(x))/fs
plt.figure(figsize=(12,3))
plt.plot(t,x)
plt.xlim([t[0],t[-1]])
plt.xlabel('time (s)')
plt.ylabel('EGM Signal')
plt.grid()
plt.show()