
Note
Go to the end to download the full example code or to run this example in your browser via JupyterLite or Binder
Independed Principle Component analysis
Using InfoMax, Extended InfoMax, FastICA, & Picard
import numpy as np
import matplotlib.pyplot as plt
#from spkit import ICA
import spkit as sp
print('spkit version :', sp.__version__)
spkit version : 0.0.9.7
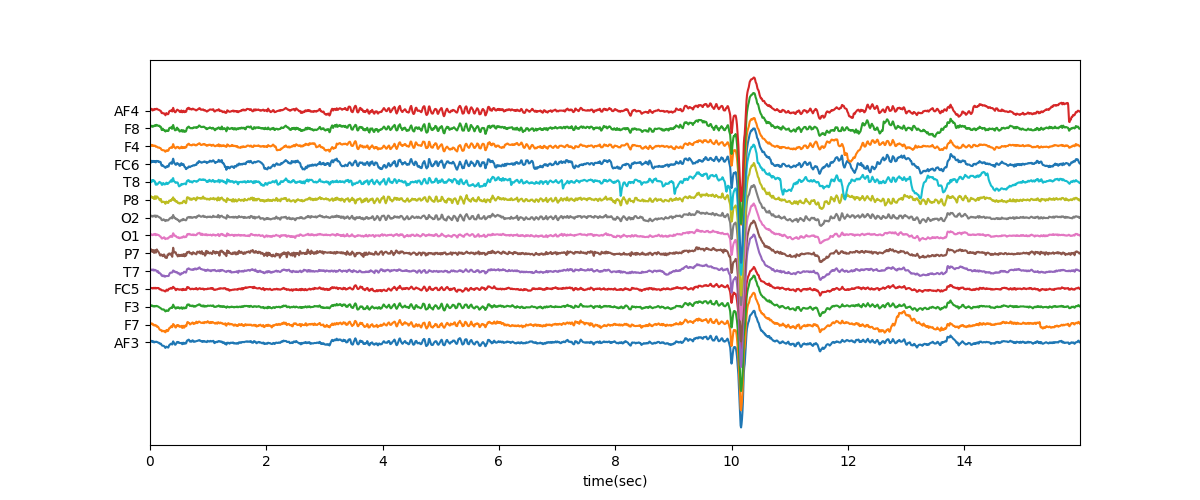
Load and filter EEG Signal
# Load sample EEG Data ( 16 sec, 128 smapling rate, 14 channel)
# Filter signal (with IIR highpass 0.5Hz)

X, fs, ch_names = sp.data.eeg_sample_14ch()
Xf = sp.filter_X(X.copy(),fs=128.0, band=[0.5], btype='highpass',ftype='SOS')
print(Xf.shape)
(2048, 14)
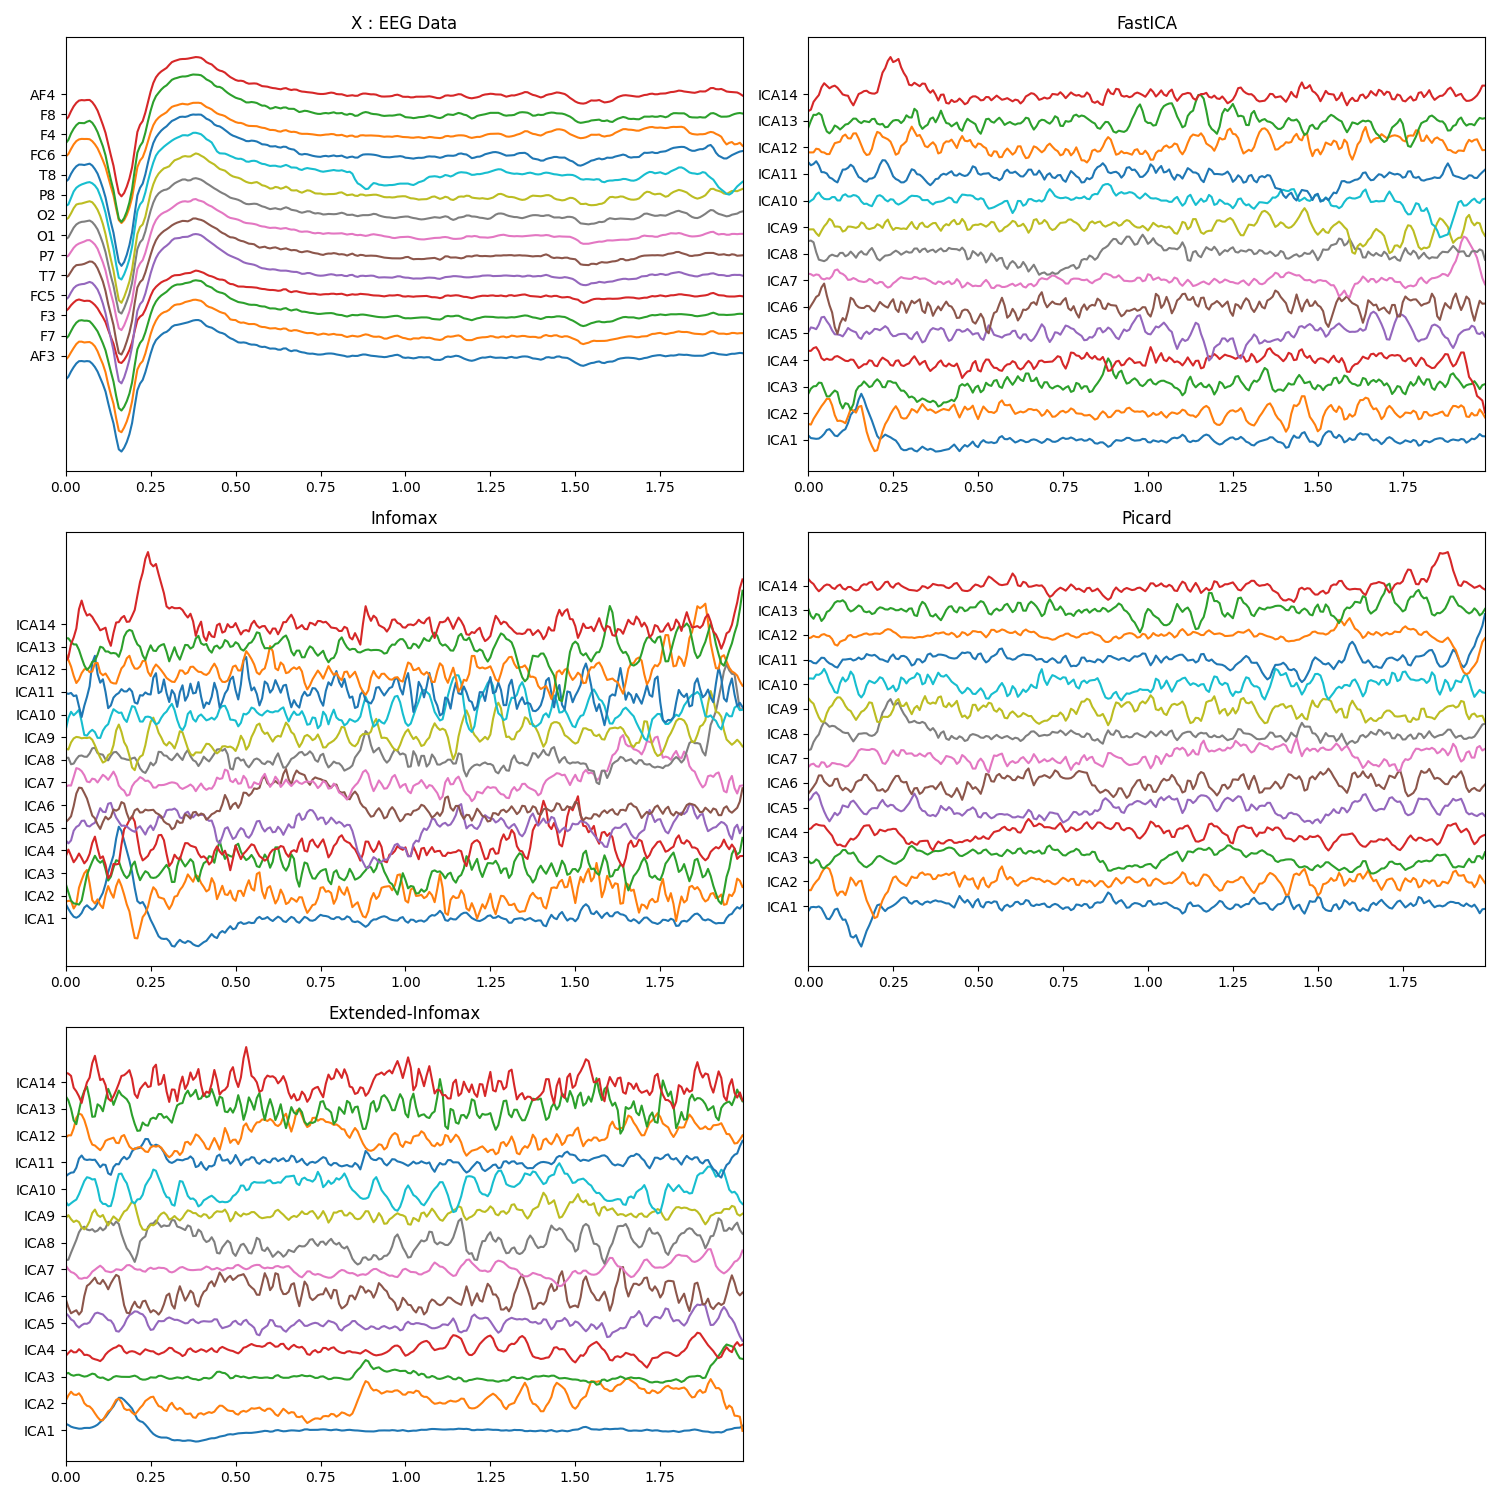
Applying ICA
methods = ('fastica', 'infomax', 'extended-infomax', 'picard')
icap = ['ICA'+str(i) for i in range(1,15)]

x = Xf[128*10:128*12,:]
t = np.arange(x.shape[0])/128.0

myICA = sp.ICA(n_components=14,method='fastica')
myICA.fit(x.T)
s1 = myICA.transform(x.T)

myICA = sp.ICA(n_components=14,method='infomax')
myICA.fit(x.T)
s2 = myICA.transform(x.T)

myICA = sp.ICA(n_components=14,method='picard')
myICA.fit(x.T)
s3 = myICA.transform(x.T)

myICA = sp.ICA(n_components=14,method='extended-infomax')
myICA.fit(x.T)
s4 = myICA.transform(x.T)
Plots
plt.figure(figsize=(15,15))
plt.subplot(321)
plt.plot(t,x+np.arange(-7,7)*200)
plt.xlim([t[0],t[-1]])
plt.yticks(np.arange(-7,7)*200,ch_names)
plt.title('X : EEG Data')

plt.subplot(322)
plt.plot(t,s1.T+np.arange(-7,7)*700)
plt.xlim([t[0],t[-1]])
plt.yticks(np.arange(-7,7)*700,icap)
plt.title('FastICA')

plt.subplot(323)
plt.plot(t,s2.T+np.arange(-7,7)*700)
plt.xlim([t[0],t[-1]])
plt.yticks(np.arange(-7,7)*700,icap)
plt.title('Infomax')

plt.subplot(324)
plt.plot(t,s3.T+np.arange(-7,7)*700)
plt.xlim([t[0],t[-1]])
plt.yticks(np.arange(-7,7)*700,icap)
plt.title('Picard')

plt.subplot(325)
plt.plot(t,s4.T+np.arange(-7,7)*700)
plt.xlim([t[0],t[-1]])
plt.yticks(np.arange(-7,7)*700,icap)
plt.title('Extended-Infomax')
plt.tight_layout()
plt.show()


t = np.arange(Xf.shape[0])/128.0
plt.figure(figsize=(12,5))
plt.plot(t,Xf+np.arange(-7,7)*200)
plt.xlim([t[0],t[-1]])
plt.xlabel('time(sec)')
plt.yticks(np.arange(-7,7)*200,ch_names)
plt.show()
Decomposition and Construction matrices (Extended InfoMax)
r"""
.. math::

    S = A\cdot (X-\mu)

    X = W\cdot S + \mu

where :math:`\mu` is mean, computed before applying PCA
"""

mu = myICA.pca_mean_[:, None]
W = myICA.get_sMatrix()
A = myICA.get_tMatrix()

s1 = np.dot(A,(x.T-mu))
x1 = np.dot(W,s4)+mu

plt.figure(figsize=(15,5))
plt.subplot(121)
plt.plot(x1.T+np.arange(-7,7)*400)
plt.yticks(np.arange(-7,7)*400,ch_names)
plt.title('Reconstructed X')
plt.subplot(122)
plt.plot(s1.T+np.arange(-7,7)*400)
plt.title('Computed ICA Ex-InfoMax')
plt.yticks(np.arange(-7,7)*400,icap)
plt.show()
print('Error X',np.sum(x1-x.T))
print('Error S',np.sum(s1-s4))
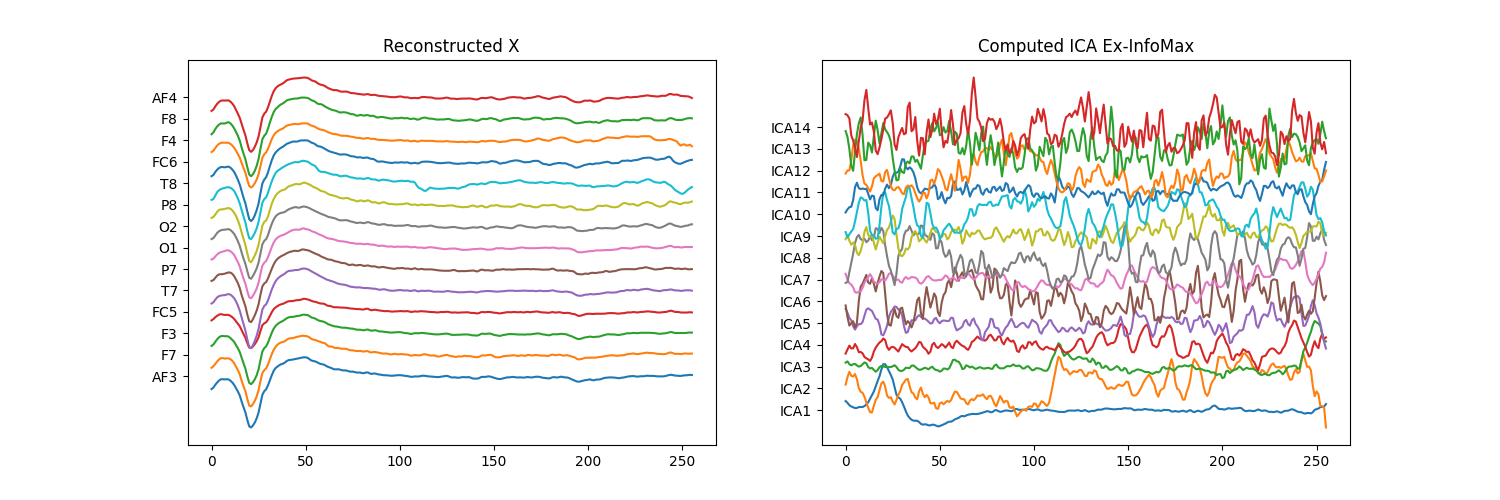
Error X 4.785559448716725e-11
Error S 7.449304058803827e-11
Total running time of the script: (0 minutes 1.705 seconds)
Related examples
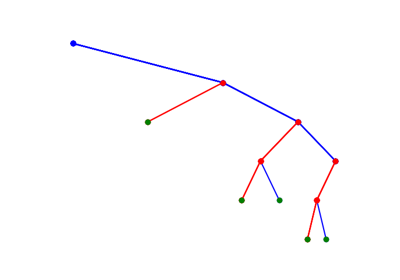
Decision Trees with visualisations while buiding tree
Decision Trees with visualisations while buiding tree