spkit.ramanujan_filter
- spkit.ramanujan_filter(x, Pmax=10, Rcq=10, Rav=2, Th=0.2, Penalty=None, return_filters=False, apply_averaging=True)
Ramanujan Filter Banks for Estimation and Tracking of Periodicity
Ramanujan Filter Banks for Estimation and Tracking of Periodicity
- Parameters:
- x1d array, sequence of signal
- Pmaxthe largest expected period.
- RcqNumber of repeats in each Ramanujan filter
- RavNumber of repeats in each averaging filter
- ThOutputs of the RFB are thresholded to zero for all values less than Th*max(output)
- Penalt = penalty for each period shape=(len(Pmax)),
If None, then set to 1, means no penalty
- Returns:
- y: 2d array of shape = (len(x),Pmax)
time vs period matrix, normalized
- if return_filters==True,
also returns
FR : list of Ramanujan Filters
FA : list of Averaging Filters
Notes
References
[1] S.V. Tenneti and P. P. Vaidyanathan, “Ramanujan Filter Banks for Estimation and Tracking of Periodicity”, Proc. IEEE Int. Conf. Acoust. Speech, and Signal Proc., Brisbane, April 2015.
[2] P.P. Vaidyanathan and S.V. Tenneti, “Properties of Ramanujan Filter Banks”, Proc. European Signal Processing Conference, France, August 2015.
Python impletation is done by using matlab code version from - http://systems.caltech.edu/dsp/students/srikanth/Ramanujan/
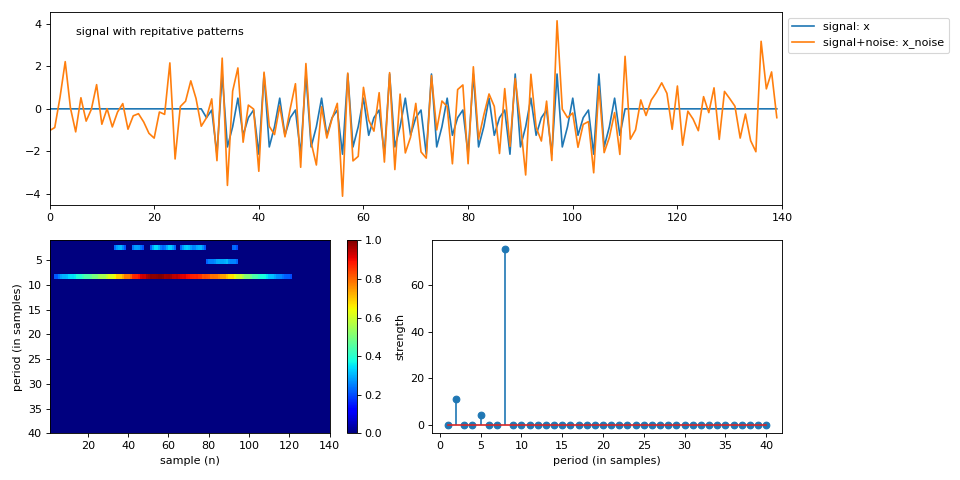
Examples
#sp.ramanujan_filter
import numpy as np
import matplotlib.pyplot as plt
import spkit as sp
np.random.seed(2)
#period = 10 #SNR = 0
period = 8
x1 = np.zeros(30)
x2 = np.random.randn(period)
x2 = np.tile(x2,10)
x3 = np.zeros(30)
x  = np.r_[x1,x2,x3]
x_noise = sp.add_noise(x,snr_db=0)
Pmax=40
y,FR, FA = sp.ramanujan_filter(x_noise,Pmax=Pmax, Rcq=15, Rav=2, Th=0.2,return_filters=True)
print('top 10 periods: ',np.argsort(np.sum(y,0))[::-1][:10]+1)
plt.figure(figsize=(12,6))
plt.subplot(211)
plt.plot(x,label='signal: x')
plt.plot(x_noise, label='signal+noise: x_noise')
plt.text(5,3.5,f'signal with repitative patterns')
plt.xlim([0,len(x)])
#plt.xlabel('sample (n)')
plt.legend(bbox_to_anchor=(1,1))
plt.subplot(223)
im = plt.imshow(y.T,aspect='auto',cmap='jet',extent=[1,len(x_noise),Pmax,1])
plt.colorbar(im)
plt.xlabel('sample (n)')
plt.ylabel('period (in samples)')
plt.subplot(224)
plt.stem(np.arange(1,y.shape[1]+1),np.sum(y,0))
plt.xlabel('period (in samples)')
plt.ylabel('strength')
plt.tight_layout()
plt.show()