spkit.mea.find_bad_channels_idx
- spkit.mea.find_bad_channels_idx(X, fs=25000, thr=2, stim_fhz=1, mnmx=[None, None], plot=False, plot_dur=2, verbose=1)
Identify the Bad Channels of MEA based on stimuli
Identify the Bad Channels of MEA based on stimuli
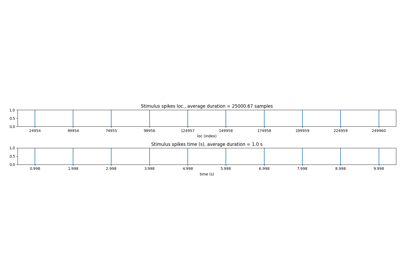
This function compute the average time of stimuli over to the maximum voltage. In MEA, ideally, a stimulus is provided with 1ms at negative max voltage (~ -1000) mV/µV and 1ms positive (~ +1000), in one cylce So, if stimulus last more than 2ms (thr) per cycle on either side, it is flagged as a bad electode.
- Parameters:
- X: nd-array
array of shape = (nch,n) = (number of channels, number of samples), multi-channel signal recording
- fs: int, default = 25KHz
sampling frequency of signal, for MEA
- thrscalar, default=2 (ms)
threshold duration for stimuli, if over the threshold on either side, channel is flagged as BAD
Note
Lower the threshold, more channels will be flagged, higher the threshold less channels will be flagged
- stim_fhz: int, float
stimuli frequency, number of stimuli per second
- mnmx: list, [min, max], default=[None, None]
voltage of stimuli, if passed [None, None],
default, then for each chennels, it is computed by its min, max value
- plot: bool, default=False
if true, all channels are plotted with ‘plot_dur’ duration
- plot_dur: float
used for plooting channels
- verbose: 0, Off mode
1, a few information printed
2, list of all channel printed with computed values and BAD flag label
- Returns:
- bad_channels_idx: list of channel index which are flagged as BAD
See also
Examples
>>> #sp.mea.find_bad_channels_idx
>>> import numpy as np
>>> import matplotlib.pyplot as plt
>>> import os, requests
>>> import spkit as sp
>>> # Download Sample file if not done already
>>> file_name= 'MEA_Sample_North_1000mV_1Hz.h5'
>>> if not(os.path.exists(file_name)):
>>>     path = 'https://spkit.github.io/data_samples/files/MEA_Sample_North_1000mV_1Hz.h5'
>>>     req = requests.get(path)
>>>     with open(file_name, 'wb') as f:
>>>             f.write(req.content)
>>> fs = 25000
>>> stim_fhz=1
>>> X,fs,ch_labels = sp.io.read_hdf(file_name,fs=fs,verbose=1)
>>> bad_channels_idx_1 = sp.mea.find_bad_channels_idx(X,thr=2,stim_fhz=stim_fhz,fs=fs,
>>>                      plot=False,plot_dur=2,verbose=1)
>>> print(bad_channels_idx_1)
    [23, 25, 27, 28, 31, 34, 36]