spkit.filterDC_sGolay
- spkit.filterDC_sGolay(X, window_length=127, polyorder=3, deriv=0, delta=1.0, mode='interp', cval=0.0, return_background=False)
Filter out DC component using Savitzky-Golay filter
Filter out DC component - Removing drift using Savitzky-Golay filter
Savitzky-Golay filter for multi-channels signal: From Scipy library
- Parameters:
- Xarray, 1d, 2d, (n,) or (n,ch)
input signal single channel (n,) or multi-channel, channel axis should be 1 shape ~ (n,ch)
- window_length: int, odd number,
length of window, larger the value, more flat drift is removed.
use smaller size to remove small duration fluctuations.
- polyorder: int, non-negetive
order of polynomial to be fitted. Higher the order, more curvey drift is captured and removed.
- others: deriv=0, delta=1.0, mode=’interp’, cval=0.0
parameters as same as in scipy.signal.savgol_filter
:(polyorder=3, deriv=0, delta=1.0, mode=’interp’, cval=0.0)
- return_background: bool, False,
If True, returns the removed drift (residual) = (X - Y)
- Returns:
- Ycorrected signal
- Xm: background removed - return only if return_background is True
See also
filterDCfilter out DC using IIR Filter
References
Examples
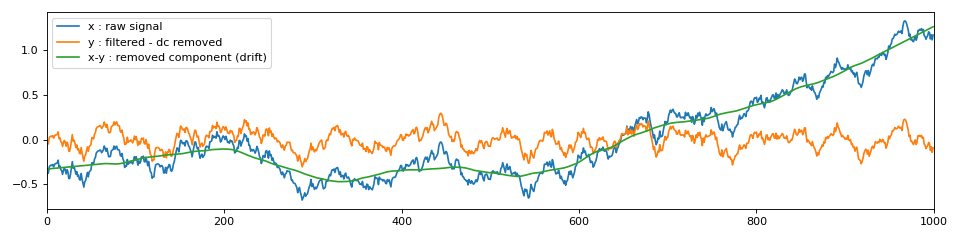
# Example 1
import numpy as np
import matplotlib.pyplot as plt
import spkit as sp
x = sp.create_signal_1d(n=1000, sg_polyorder=1, sg_winlen=1, seed=1)
x -= x.mean()
y = sp.filterDC_sGolay(x.copy(),window_length=127, polyorder=1)
plt.figure(figsize=(12,3))
plt.plot(x,label='x : raw signal')
plt.plot(y,label='y : filtered - dc removed')
plt.plot(x-y,label='x-y : removed component (drift)')
plt.legend()
plt.xlim([0,len(x)])
plt.tight_layout()
plt.show()
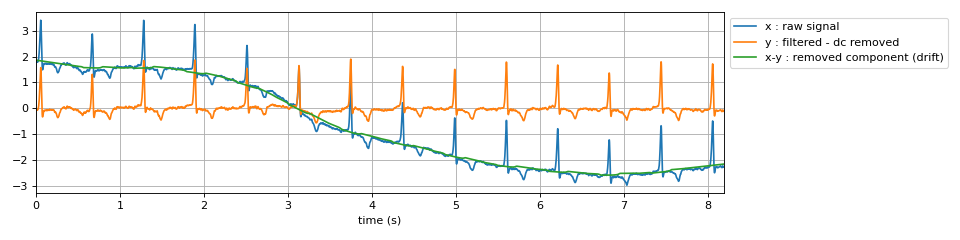
###################################
# Example 2
import numpy as np
import matplotlib.pyplot as plt
import spkit as sp
X,fs,lead_names = sp.data.ecg_sample_12leads(sample=1)
x = X[:,0]
t = np.arange(x.shape[0])/fs
y = sp.filterDC_sGolay(x.copy(),window_length=fs, polyorder=1)
plt.figure(figsize=(12,3))
plt.plot(t,x,label='x : raw signal')
plt.plot(t,y,label='y : filtered - dc removed')
plt.plot(t,x-y,label='x-y : removed component (drift)')
plt.xlim([t[0],t[-1]])
plt.legend(bbox_to_anchor=(1,1))
plt.grid()
plt.xlabel('time (s)')
plt.tight_layout()
plt.show()