spkit.filterDC
- spkit.filterDC(X, alpha=256, return_background=False, initialize_zero=True)
Filter out DC component using IIR filter
Filter out DC component - Remving drift using Recursive (IIR type) filter
\[y[n] = ((alpha-1)/alpha) * ( x[n] - x[n-1] -y[n-1])\]where \(y[-1] = x[0]\), \(x[-1] = x[0]\) resulting \(y[0] = 0\)
Implemenatation works for single (1d array) or multi-channel (2d array)
- Parameters:
- Xarray, 1d, 2d, (n,) or (n,ch)
input signal single channel (n,) or multi-channel, channel axis should be 1 shape ~ (n,ch)
- alpha: scalar, default alpha=256
filter coefficient, higher it is, more suppressed dc component (0 frequency component)
with alpha=256, dc component is suppressed by 20 dB
- initialize_zero: bool, default True
If True, running background b will be initialize it with x[0], resulting y[0] = 0
if False, b = 0, resulting y[0] ~ x[0], and slowly drifting towards zeros line
recommended to set True
- Returns:
- Youtput vector,
- shape same as input X (n,) or (n,ch)
See also
filterDC_sGolayfilter out DC using Savitzky-Golay filter
Notes
filterDCemployes causal IIR filter to remove drift from signal, which introduces the shift (delay) in the filtered signal. It is recommonded to check outfilterDC_sGolay
References
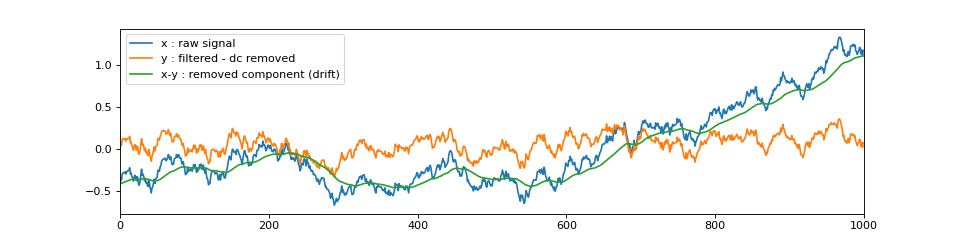
Examples
import numpy as np
import matplotlib.pyplot as plt
import spkit as sp
x = sp.create_signal_1d(n=1000, sg_polyorder=1, sg_winlen=1, seed=1)
x -= x.mean()
y = sp.filterDC(x.copy(),alpha=32)
plt.figure(figsize=(12,3))
plt.plot(x,label='x : raw signal')
plt.plot(y,label='y : filtered - dc removed')
plt.plot(x-y,label='x-y : removed component (drift)')
plt.legend()
plt.xlim([0,len(x)])
plt.show()