spkit.create_signal_1d
- spkit.create_signal_1d(n=100, seed=None, circular=False, bipolar=True, sg_winlen=11, sg_polyorder=1, max_dxdt=0.1, iterations=2, max_itr=10, **kwargs)
Generate 1D arbitary signal
Simulating arbitary signal
- Parameters:
- n: int, default=100
number of sampels
- seed: int, defualt=None,
random seed, to re-generate same signal
- circular: bool, deault=False,
if True, then starting and ending value of the signal will be roughly same.
if will signal starts from 0, it will end near to 0.
useful for geometric operations.
- bipolar: bool, default=True
if True, signal will vary from -1 to +1
else from 0 to 1
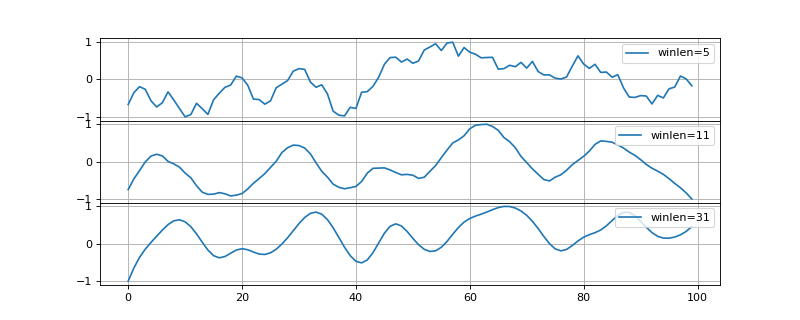
- sg_winlen: int,deault=11
window length, heigher the window size, smoother the signal will be
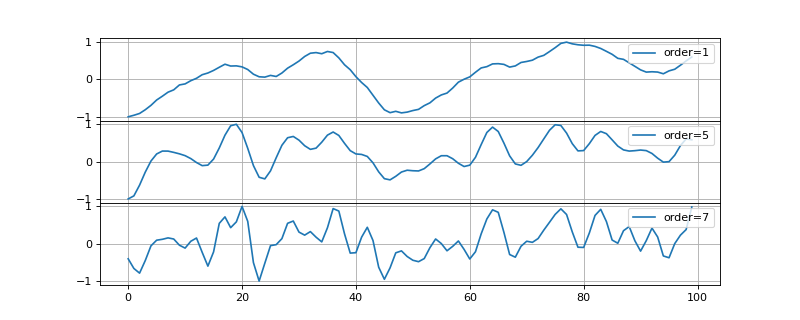
- sg_polyorder: int, >0
order of polynomial,
higher the order, more curvy the signal will be
smaller the order, more smoother and flat-like signal will be
- max_dxdt: float, deafult=0.1
maximum derivative in the signal,
generated signal will be iteratively smoothen, untill, maximum derivative is <=`max_dxdt`
or maximum number of iterations
max_itrare achived, when (max_dxdt) is not None
- max_itr: int, deafult=10
maximum number of iterations to achive
max_dxdtif None, then
iterationsare used, regardless ofmax_dxdtvalue.
- iterations: int, deafault=2
if
max_itris None, theniterationsmany iterations are used to smoothen the signal.
- Returns:
- x: 1d-array of n samples
See also
Notes
#TODO
Examples
#sp.create_signal_1d
import numpy as np
import matplotlib.pyplot as plt
import spkit as sp
seed=11
x1 = sp.create_signal_1d(n=100,sg_winlen=5,seed=seed)
x2 = sp.create_signal_1d(n=100,sg_winlen=11,seed=seed)
x3 = sp.create_signal_1d(n=100,sg_winlen=31,seed=seed)
plt.figure(figsize=(10,4))
plt.subplot(311)
plt.plot(x1,label='winlen=5')
plt.legend(loc='upper right')
plt.grid()
plt.subplot(312)
plt.plot(x2,label='winlen=11')
plt.legend(loc='upper right')
plt.grid()
plt.subplot(313)
plt.plot(x3,label='winlen=31')
plt.legend(loc='upper right')
plt.grid()
plt.subplots_adjust(hspace=0)
plt.show()
############################################
#sp.create_signal_1d
import numpy as np
import matplotlib.pyplot as plt
import spkit as sp
seed=1
x1 = sp.create_signal_1d(n=100,sg_winlen=11,sg_polyorder=1,seed=seed)
x2 = sp.create_signal_1d(n=100,sg_winlen=11,sg_polyorder=5,seed=seed)
x3 = sp.create_signal_1d(n=100,sg_winlen=11,sg_polyorder=7,seed=seed)
plt.figure(figsize=(10,4))
plt.subplot(311)
plt.plot(x1,label='order=1')
plt.legend(loc='upper right')
plt.grid()
plt.subplot(312)
plt.plot(x2,label='order=5')
plt.legend(loc='upper right')
plt.grid()
plt.subplot(313)
plt.plot(x3,label='order=7')
plt.legend(loc='upper right')
plt.grid()
plt.subplots_adjust(hspace=0)
plt.show()