spkit.create_signal_2d
- spkit.create_signal_2d(n=100, seed=None, sg_winlen=11, sg_polyorder=1, iterations=1, max_dxdt=0.1, max_itr=None)
Generate 2D arbitary signal/image patch
Generate a 2D Grid of (n, n)
- Parameters:
- n: int, default=100
number of pixels, height and width
(n,n) matrix grid
- seed: int, defualt=None,
random seed, to re-generate same signal
- sg_winlen: int,deault=11
window length, heigher the window size, smoother the image will be
- sg_polyorder: int, >0
order of polynomial,
higher the order, more patchy the image will be
smaller the order, more smoother and flat-like image will be
- max_dxdt: float, deafult=0.1
maximum derivative in of the each row,
generated row will be iteratively smoothen, untill, maximum derivative is <=`max_dxdt`
or maximum number of iterations
max_itrare achived, when (max_dxdt) is not None
- max_itr: int, deafult=10
maximum number of iterations to achive
max_dxdtif None, then
iterationsare used, regardless ofmax_dxdtvalue.
- iterations: int, deafault=1
if
max_itris None, theniterationsmany iterations are used to smoothen the image.
- Returns:
- I: (n,n) array
See also
spkit#TODO
Notes
#TODO
References
wikipedia -
Examples
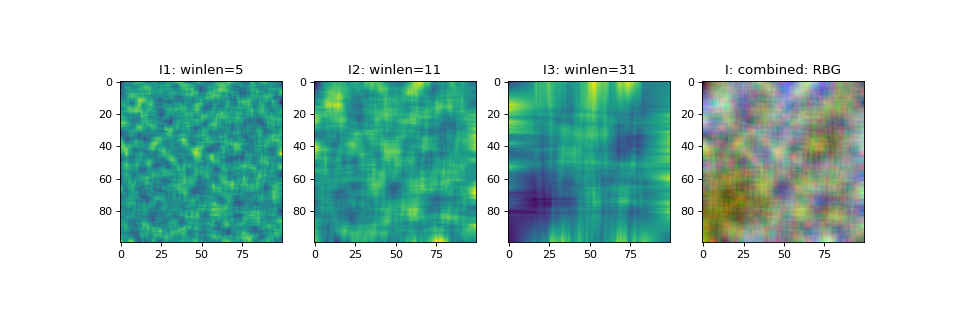
#sp.create_signal_2d
import numpy as np
import matplotlib.pyplot as plt
import spkit as sp
seed=11
I1 = sp.create_signal_2d(n=100,sg_winlen=5,seed=seed,iterations=1)
I2 = sp.create_signal_2d(n=100,sg_winlen=11,seed=seed,iterations=1)
I3 = sp.create_signal_2d(n=100,sg_winlen=31,seed=seed,iterations=1)
I = np.stack([I1,I2,I3],axis=-1)
plt.figure(figsize=(12,4))
plt.subplot(141)
plt.imshow(I1)
plt.title('I1: winlen=5')
plt.subplot(142)
plt.imshow(I2)
plt.title('I2: winlen=11')
plt.subplot(143)
plt.imshow(I3)
plt.title('I3: winlen=31')
plt.subplot(144)
plt.title('I: combined: RBG')
plt.imshow(I)
plt.show()
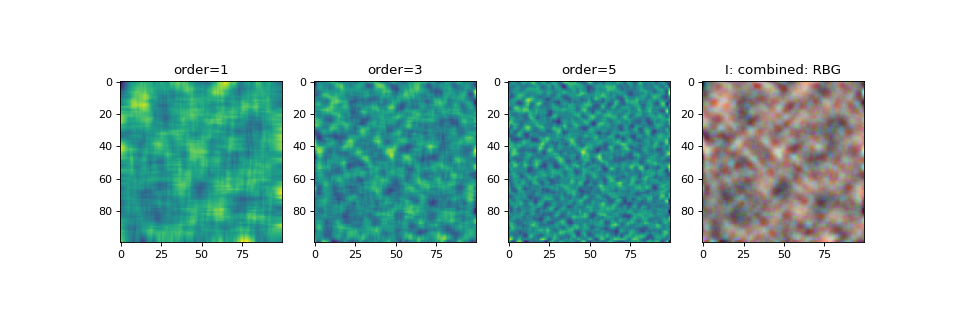
#################################
#sp.create_signal_2d
import numpy as np
import matplotlib.pyplot as plt
import spkit as sp
seed=11
I1 = sp.create_signal_2d(n=100,sg_polyorder=1,seed=seed,iterations=1)
I2 = sp.create_signal_2d(n=100,sg_polyorder=3,seed=seed,iterations=1)
I3 = sp.create_signal_2d(n=100,sg_polyorder=5,seed=seed,iterations=1)
I = np.stack([I1,I2,I3],axis=-1)
plt.figure(figsize=(12,4))
plt.subplot(141)
plt.imshow(I1)
plt.title('order=1')
plt.subplot(142)
plt.imshow(I2)
plt.title('order=3')
plt.subplot(143)
plt.imshow(I3)
plt.title('order=5')
plt.subplot(144)
plt.title('I: combined: RBG')
plt.imshow(I)
plt.show()