spkit.show_compass
- spkit.show_compass(Ax_theta, Ax_bad=[], arr_agg='mean', figsize=(10, 6), all_arrow_prop={'alpha': 0.2, 'edgecolor': 'C0', 'facecolor': 'C0', 'lw': 1, 'width': 0.05, 'zorder': 10}, avg_arrow_prop={'edgecolor': 'C3', 'facecolor': 'C3', 'lw': 4, 'width': 0.045, 'zorder': 100}, title='CV')
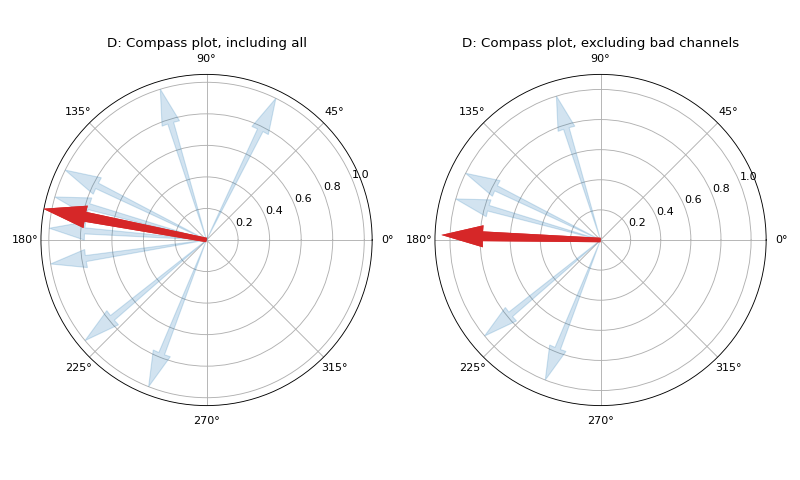
Display Compass with Arrows and aggregated Arrow
Display Compass with Arrows and aggregated Arrow
- Plot two compasses:
With all the arrows of angles as provided in
Ax_theta, along with averaged direction
Only if
Ax_badis provided;
With arrows excluding one indicated as bad (
np.nan,NaN) inAx_badalong with averaged direction
- Parameters:
- Ax_theta: 2D-array,
e.g. MEA Feature matrix, of Angles of directions
1D-array should work as well.
It can include NaN (
np.nan) values, which will be ignored
- Ax_bad2D-array,
Same size array as Ax_theta, with 1 and np.nan (
NaNs) value1 for good channel,
NaNfor bad channeldefault = [], in which case only one plot is shown
- arr_agg: str {‘mean’, ‘media’}, default=’mean’
how to aggregate angles
- Returns:
- Ax_theta_avgAggregated Angle, including all the values
- Ax_theta_avg_bd: Aggregated Angle, excluding bad channels, indicated by
NaNin Ax_bad, if Ax_bad is provided, else same as Ax_theta_avg
See also
Notes
#TODO
References
wikipedia -
Examples
>>> import numpy as np
>>> import matplotlib.pyplot as plt
>>> import spkit as sp
>>> np.random.seed(2)
>>> N=8
>>> Ax_theta= np.arctan2(np.random.randn(N)+1, np.random.randn(N)-1)
>>> Ax_bad   = 1*(np.random.rand(N)>0.4).astype(float)
>>> Ax_bad[Ax_bad==0]=np.nan
>>> sp.show_compass(Ax_theta, Ax_bad,arr_agg='mean',title='D')
>>> plt.show()