spkit.mea.compute_cv
- spkit.mea.compute_cv(Ax, Ax_bad, eD=700, esp=1e-10, cv_pad=nan, cv_thr=100, arr_agg='mean', plots=1, verbose=True, flip=False, silent_mode=False, **kwargs)
Compute Conduction Velocity
Compute Conduction Velocity
Given Activation Time Matrix as MEA -Grid form, computing Conduction Velocity
- Parameters:
- Ax: MEA Grid 8x8
Interpolated Activation time matrix as MEA grid form.
Ax should not have any NaN values. Use ‘fill_nans_2d’ to fill NaN values or replace Bad channel values
- Ax_bad: MEA Grid 8x8
Matrix of 1 and np.nan values indicating bad channels.
np.nan value corresponds to channel location indicate bad channel
- eD: scaler, (default=700 mm)
Inter-Node Distance
distance between two nodes in horizontal and vertical axis on MEA electrode-plate distance is given in mm
- esp: scalar, default =1e-10
epsilon
to avoid diving by zero, esp is used
- cv_thr: scalar, default=100 cm/s
threshold on conduction velocity to exclude
any electrodes shows cv>=cv_thr is replaced by ‘cv_pad’ (np.nan)
- cv_pad: scalar default=np.nan
replacement value
any cv value above cv_thr is replaced by cv_pad, to avoid including in computation
- arr_agg: str, {‘mean’,’median’} default=’mean’
method to aggregate the directional arrows, mean or median
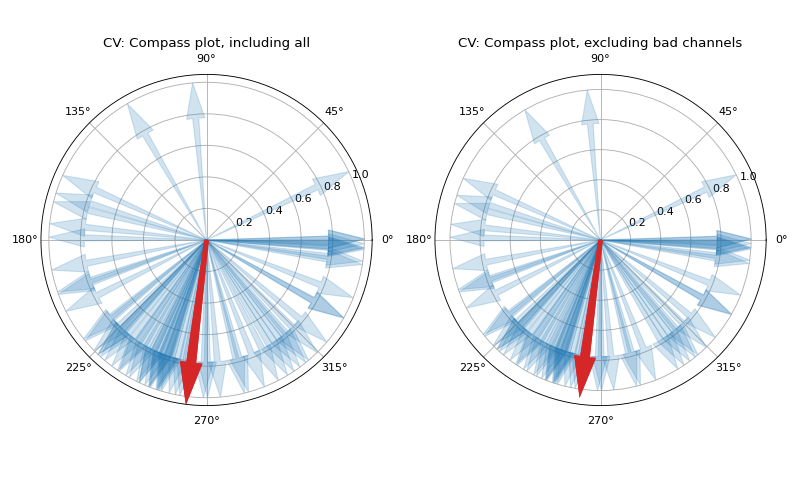
- plots: int, default=1
if 1, plot two figures for CV maps, two figures for directional compass
if 2, also plot activation matrix and conduction velocity matrix with more details
- verbose: boot, default=True
verbosity
print information
- flip=False:
KEEP IT FALSE, DEV. MODE
- Returns:
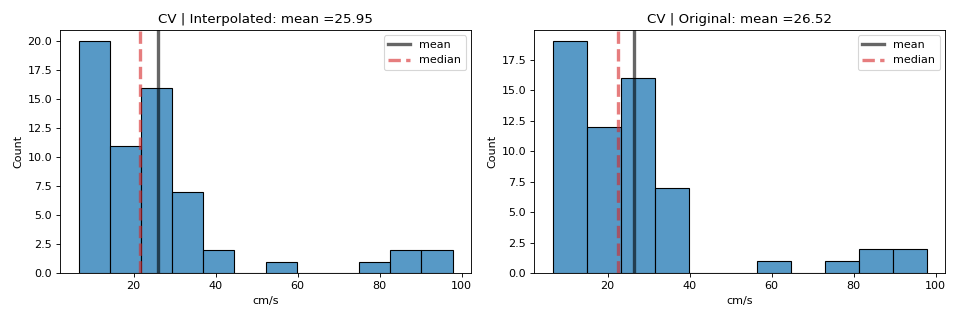
- CV_df: pandas Dataframe,
including ‘CV_mean’,’CV_median’,’CV_sd’,’inv_speed’,’avg_angle’ computations
for ‘Interpolated values’ and ‘Original Values’. Original values exclude the Bad channels
- Ax_theta: MEA Grid 8x8
Angle of direction for cv at each elctrodes, as a Featire Matix Form
- CV0: MEA Grid 8x8
Conducntion Velocity matrix, that includes inpterpolated values
- CVMEA Grid 8x8
Conducntion Velocity matrix, excluding Bad Channels values
Examples
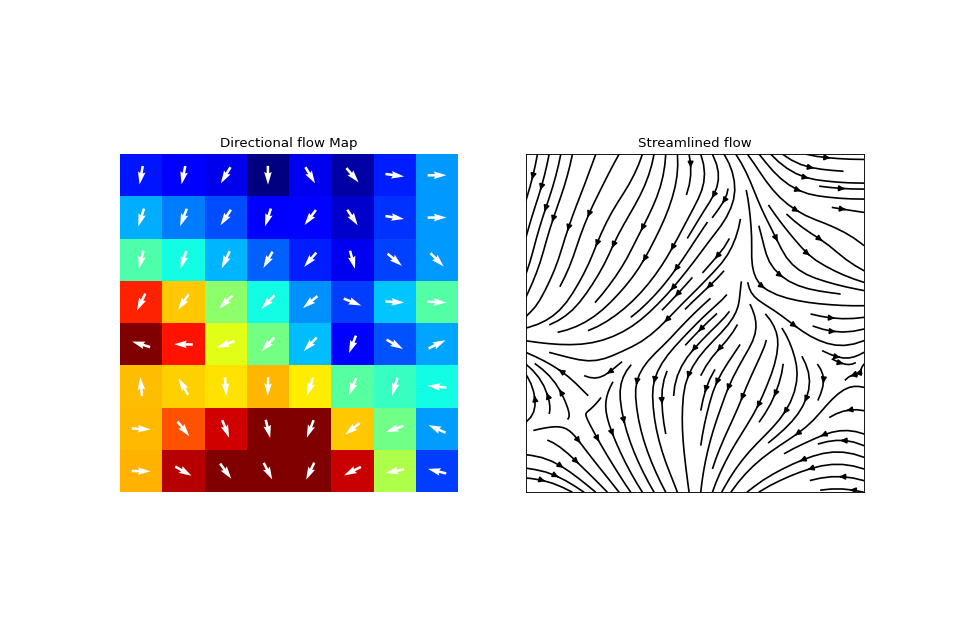
#sp.mea.compute_cv
import numpy as np
import matplotlib.pyplot as plt
import spkit as sp
Ax = sp.create_signal_2d(n=8,sg_winlen=5, sg_polyorder=1,seed=2)*30
Ax_bad = np.ones([8,8])
Ax_bad[(Ax>25)] = np.nan
Ax_bad[np.isnan(Ax)] = np.nan

CV_df, Ax_theta, CV0, CV = sp.mea.compute_cv(Ax,Ax_bad,eD=700,esp=1e-10,cv_pad=np.nan,cv_thr=100,arr_agg='mean',
        plots=1,verbose=True,flip=False,silent_mode=False)

_ = sp.direction_flow_map(X_theta=Ax_theta,X=Ax,arr_pivot='mid',heatmap_prop =dict(vmin=0,vmax=20,cmap='jet'),)