spkit.filter_with_kernel
- spkit.filter_with_kernel(X, kernel, iterations=1, mode='same')
Smoothing/Sharpening using given kernel and 1d-ConvFB
Smoothing/Sharpening using given kernel and 1d-ConvFB
Smoothing/Sharpening depends on kernel
- Parameters:
- Xarray,
input signal single channel (n,) or multi-channel, channel axis should be 1 shape ~ (n,ch)
- kernelcustamised kernel for
- iterations: int, >=1, repeating gaussian smoothing iterations times
- mode: convolution mode in {‘same’,’valid’,’full’}, ‘same make sense’
- Returns:
- Yprocesed signal
See also
filter_smooth_sGolaySmoothing signal using Savitzky-Golay filter
filter_smooth_gaussSmoothing signal using Gaussian kernel
filter_smooth_mollifierSmoothing signal using Mollifier
filter_XSpectral filtering
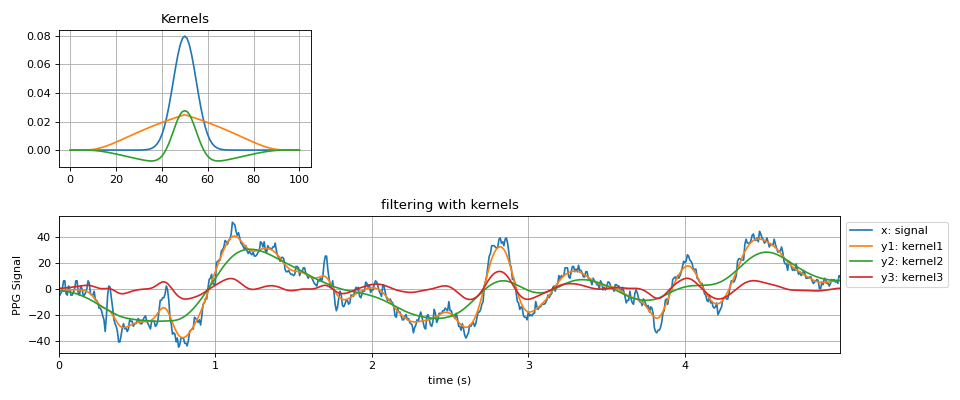
Examples
#sp.filter_with_kernel
import numpy as np
import matplotlib.pyplot as plt
import spkit as sp
x,fs = sp.data.ppg_sample(sample=1)
x = x[:int(fs*5)]
x = x - x.mean()
t = np.arange(len(x))/fs
kernel1 = sp.gaussian_kernel(window_length=101,sigma_scale=10)
kernel2 = sp.friedrichs_mollifier_kernel(window_size=101,s=1,p=1)
kernel3 = (kernel1 - kernel2)/2
y1 = sp.filter_with_kernel(x.copy(),kernel=kernel1)
y2 = sp.filter_with_kernel(x.copy(),kernel=kernel2)
y3 = sp.filter_with_kernel(x.copy(),kernel=kernel3)
plt.figure(figsize=(12,5))
plt.subplot(212)
plt.plot(t,x,label='x: signal')
plt.plot(t,y1,label='y1: kernel1')
plt.plot(t,y2,label='y2: kernel2')
plt.plot(t,y3,label='y3: kernel3')
plt.xlim([t[0],t[-1]])
plt.xlabel('time (s)')
plt.ylabel('PPG Signal')
plt.grid()
plt.legend(bbox_to_anchor=(1,1))
plt.title('filtering with kernels')
plt.subplot(231)
plt.plot(kernel1,label='kernel1')
plt.plot(kernel2,label='kernel2')
plt.plot(kernel3,label='kernel3')
plt.title('Kernels')
plt.grid()
plt.tight_layout()
plt.show()