spkit.filter_smooth_gauss
- spkit.filter_smooth_gauss(X, window_length=11, sigma_scale=2.7, iterations=1, mode='same')
Smoothing filter using Gaussian Kernel and 1d-ConvFB
Smoothing filter using Gaussian Kernel and 1d-ConvFB
sigma : sigma for gaussian kernel, if None, sigma=window_length/6
- Parameters:
- Xarray,
input signal single channel (n,) or multi-channel, channel axis should be 1 shape ~ (n,ch)
- window_length: int >1, length of gaussian kernel
- sigma_scale: float, deafult=2.7
To control width/spread of gauss
- iterations: int, >=1, default=1
repeating gaussian smoothing iterations times
- mode: {‘same’,’valid’,’full’},
convolution mode in ,
samemake sense.
- Returns:
- YSmoothed signal
See also
filter_smooth_sGolaySmoothing signal using Savitzky-Golay filter
filter_smooth_mollifierSmoothing signal using Mollifier
filter_with_kernelfiltering signal using custom kernel
filter_XSpectral filtering
References
wikipedia
Examples
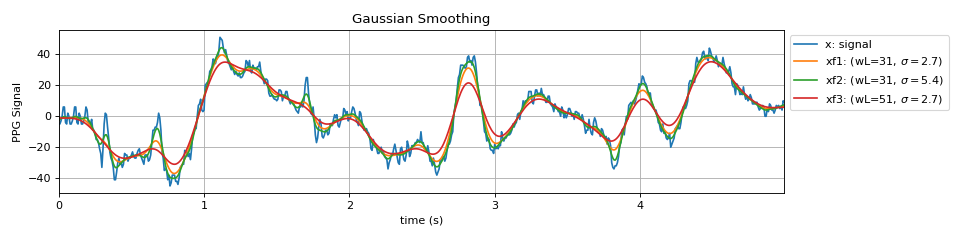
#sp.filter_smooth_gauss
import numpy as np
import matplotlib.pyplot as plt
import spkit as sp
x,fs = sp.data.ppg_sample(sample=1)
x = x[:int(fs*5)]
x = x - x.mean()
t = np.arange(len(x))/fs
xf1 = sp.filter_smooth_gauss(x.copy(),window_length=31, sigma_scale=2.7)
xf2 = sp.filter_smooth_gauss(x.copy(),window_length=31, sigma_scale=5.4)
xf3 = sp.filter_smooth_gauss(x.copy(),window_length=51, sigma_scale=2.7)
plt.figure(figsize=(12,3))
plt.plot(t,x,label='x: signal')
plt.plot(t,xf1,label=r'xf1: (wL=31, $\sigma=2.7$)')
plt.plot(t,xf2,label=r'xf2: (wL=31, $\sigma=5.4$)')
plt.plot(t,xf3,label=r'xf3: (wL=51, $\sigma=2.7$)')
plt.xlim([t[0],t[-1]])
plt.xlabel('time (s)')
plt.ylabel('PPG Signal')
plt.grid()
plt.legend(bbox_to_anchor=(1,1))
plt.title('Gaussian Smoothing')
plt.tight_layout()
plt.show()
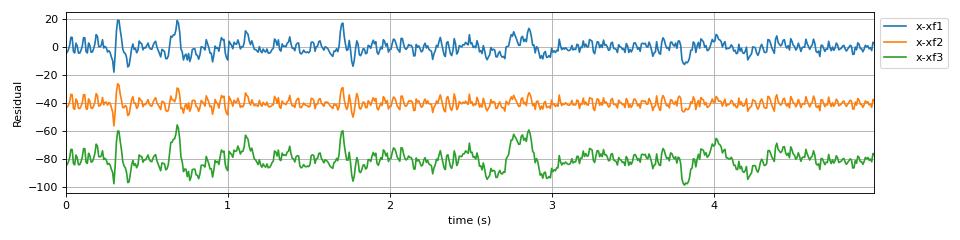
plt.figure(figsize=(12,3))
plt.plot(t,x-xf1,label='x-xf1')
plt.plot(t,x-xf2-40,label='x-xf2')
plt.plot(t,x-xf3-80,label='x-xf3')
plt.xlim([t[0],t[-1]])
plt.xlabel('time (s)')
plt.ylabel('Residual')
plt.legend(bbox_to_anchor=(1,1))
plt.grid()
plt.tight_layout()
plt.show()