spkit.eeg.rhythmic_powers_win
- spkit.eeg.rhythmic_powers_win(X, winsize=128, overlap=None, fs=128.0, fBands=[[4], [8, 14]], Sum=True, Mean=False, SD=False, verbose=0, **kwargs)
Rhythmic powers-window-wise
Decompose EEG Signal(s)-all the channels in Rhythms and compute power in each band for each channel
- Parameters:
- X: array,
EEG segment of shape (n,ch) or (n,)
where ch is number of channels
- winsize: int, default=128
size of window for computing powers
- overlap: int, default=None
overlap shift,
number of samples to be shift
if None, overlap=winsize//2
- fs: int,
sampling rate
- fBands: list
list of frequency bands
if None: fBands =[[4],[4,8],[8,14],[14,30],[30,47],[47]]
default [[4],[8,14]], ‘delta’ and ‘alpha’
- (Sum,Mean,SD): bool, default (True, False, False)
if Sum=True, then Total power spectrum in the band computed, default=True
if Mean=True, then Average power of the band is computed, default=False
if SD=True, then Standard Deviation, (variation) in power for band is computed, default=False
- verbose: int, default=0
verbosity mode
- kwargs:
all the parameters as they are for
rhythmic_powers
- filter_kwargs: dict, default=dict()
arguments for filtering, check
filter_Xfor detailsdefault arguments setting is: dict(order=5,ftype=’SOS’,verbose=False)
- To override any of the argument or suply additional argument based of
filter_X, provide the in
filter_kwargs.
- To override any of the argument or suply additional argument based of
For example, filter_kwargs = dict(ftype=’filtfilt’), will overide the
ftype.
- periodogram_kwargs:dict, default=dict()
arguments for periodogram, check
periodogramfor details- default arguments setting is:
- dict(method=’welch’,win=’hann’,scaling=’density’,nfft=None, average=’mean’,
detrend=’constant’,nperseg=None,noverlap=None,show_plot=False)
- To override any of the argument or suply additional argument based of
periodogram, provide the in
periodogram_kwargs.
- To override any of the argument or suply additional argument based of
For example, periodogram_kwargs = dict(win=’ham’), will overide the
win.
- filter_warn: bool, default=True
It will show warning, if any additional argument other than deafult setting for filter, is provided
To turn warning statement off, set filter_warn=False
- periodogram_warn=True,
It will show warning, if any additional argument other than deafult setting for periodogram is provided
To turn warning statement off, set filter_warn=False
- Returns:
- Pxt: 3d-array.
sum of the power in a band - shape (nt, number of bands,nch)
- Pmt: 3d-array.
mean power in a band - shape (nt, number of bands,nch)
- Pdt: 3d-array.
standard deviation of power in a band - shape (nt, number of bands,nch)
See also
Examples
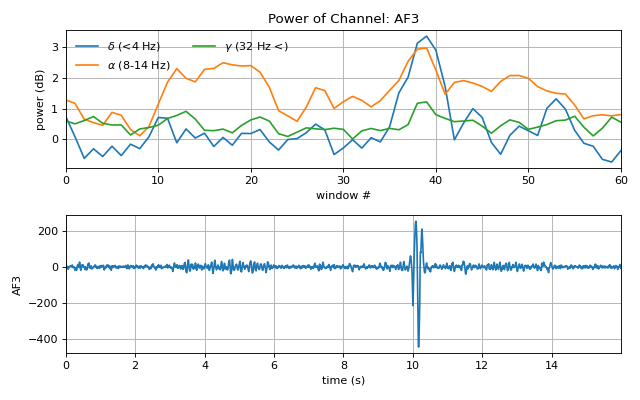
#sp.eeg.rhythmic_powers_win
import numpy as np
import matplotlib.pyplot as plt
import spkit as sp
X,fs, ch_names = sp.data.eeg_sample_14ch()
X = sp.filterDC_sGolay(X, window_length=fs//3+1)
t = np.arange(X.shape[0])/fs
Pxt, _, _ = sp.eeg.rhythmic_powers_win(X, winsize=128,overlap=32,fBands=[[4],[8,14],[32,47]],Sum=True)
Pxt = np.log10(Pxt)
plt.figure(figsize=(8,5))
plt.subplot(211)
plt.plot(Pxt[:,:,0], label=[r'$\delta$ (<4 Hz)',r'$\alpha$ (8-14 Hz)',r'$\gamma$ (32 Hz <)',])
plt.xlabel('window #')
plt.ylabel('power (dB)')
plt.title(f'Power of Channel: {ch_names[0]}')
plt.xlim([0,Pxt.shape[0]-1])
plt.grid()
plt.legend(ncol=2,frameon=False)
plt.subplot(212)
plt.plot(t,X[:,0])
plt.grid()
plt.xlim([t[0],t[-1]])
plt.xlabel('time (s)')
plt.ylabel(ch_names[0])
plt.tight_layout()
plt.show()