spkit.wpa_coeff
- spkit.wpa_coeff(x, wv='db3', mode='symmetric', maxlevel=None, verticle_stacked=True)
Wavelet Packet Decomposition
Wavelet Packet Decomposition
- Parameters:
- x: 1d signal array
- wvwavelet type, default = ‘db3’
- mode: {‘symmetric’, ..}, default=’symmetric’
- maxlevel: int, or None, default=None
maximum levels of decomposition will result in 2**maxlevel packets
- verticle_stacked: bool, default=True
if True, coefficients are vertically stacked - good for temporal alignment
- Returns:
- WK: Wavelet Packet Coeeficients
if verticle_stacked True : shape (2**maxlevel, k), 2**maxlevel - packets with k coeeficient in each
if verticle_stacked False: shape (2**maxlevel * k, )
See also
spkit#TODO
Notes
#TODO
References
Examples
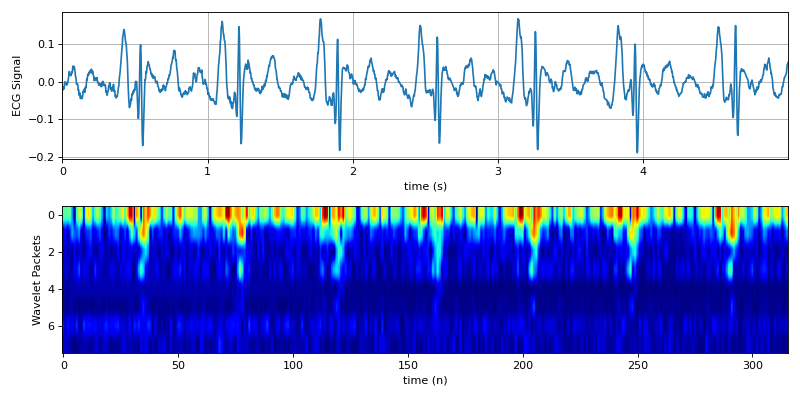
#sp.wpa_coeff
import numpy as np
import matplotlib.pyplot as plt
import spkit as sp
x,fs,lead_names = sp.data.ecg_sample_12leads(sample=2)
x = x[:int(fs*5),5]
x = sp.filterDC_sGolay(x, window_length=fs//3+1)
t = np.arange(len(x))/fs
WK = sp.wpa_coeff(x,wv='db3',mode='symmetric',maxlevel=3, verticle_stacked=True)
plt.figure(figsize=(10,5))
plt.subplot(211)
plt.plot(t,x)
plt.xlim([t[0],t[-1]])
plt.xlabel('time (s)')
plt.ylabel('ECG Signal')
plt.grid()
plt.subplot(212)
plt.imshow(np.log(np.abs(WK)+0.01),aspect='auto',cmap='jet',)
plt.ylabel('Wavelet Packets')
plt.xlabel('time (n)')
plt.tight_layout()
plt.show()