spkit.stats.outliers
- spkit.stats.outliers(x, method='iqr', k=1.5, include_lower=True, include_upper=True, return_thr=False)
Statistical Outliers
This function computes lower and upper limits beyond which all the point are assumed to be outliers
IQR - Interquartile Range
\[ \begin{align}\begin{aligned}l_t = Q3 + k \times (Q3-Q1)\\u_t = Q3 - k \times (Q3-Q1)\end{aligned}\end{align} \]where \(k=1.5\) and Q1 is first quartile, Q3 and 3rd Quartile
Standard Deviation
\[ \begin{align}\begin{aligned}l_t = k \times SD(x)\\u_t = - k \times SD(x)\end{aligned}\end{align} \]where \(k=1.5\) and \(SD(\cdot)\) is Standard Deviation
- Parameters:
- x: 1d array or list
if x included NaNs, they are excluded
- method: str {‘iqr’,’sd’}
method to compute lower/upper limits according to above equations
- k: scalar, default k=1.5
used as per eqaution
- include_lower: bool, default=True
if False, lower threshold is excluded
- include_upper: bool, default=True
if False, upper threshold is excluded
- return_thr: bool,default = False
if True, lower and upper thresholds are returnes
- Returns:
- x_outlr: outliers indentified from x
- idxindices
indices of the outliers in x, after removing Nans
indices are for xi, xi = x[~np.isnan(x)]
- idx_bin: bool array
indices of outliers
- (lt,ut)tupple,
lower and upper limit
returns only if
return_thris True
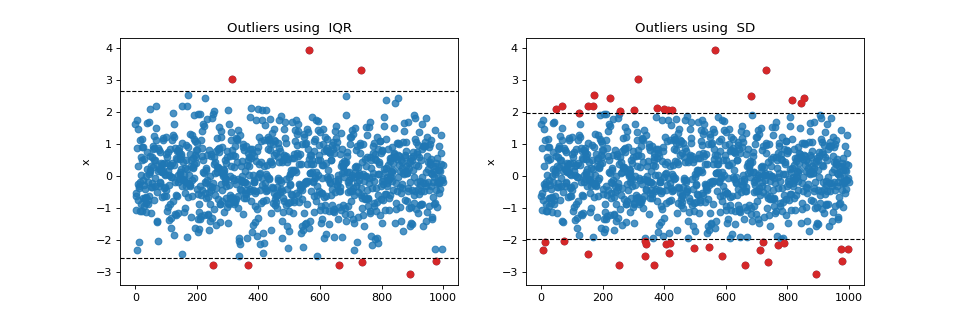
Examples
#sp.stats.outliers
import numpy as np
import matplotlib.pyplot as plt
import spkit as sp

np.random.seed(1)
x = np.random.randn(1000)
t = np.arange(len(x))
np.random.seed(None)

x_outlr1, idx1, _, (lt1,ut1) = sp.stats.outliers(x,method='iqr',return_thr=True)
x_outlr2, idx2, _, (lt2,ut2) = sp.stats.outliers(x,method='sd',k=2,return_thr=True)

plt.figure(figsize=(12,4))
plt.subplot(121)
plt.plot(t,x,'o',color='C0',alpha=0.8)
plt.plot(t[idx1],x[idx1],'o',color='C3')
plt.axhline(lt1,color='k',ls='--',lw=1)
plt.axhline(ut1,color='k',ls='--',lw=1)
plt.title('Outliers using  IQR')
plt.ylabel('x')
plt.subplot(122)
plt.plot(t,x,'o',color='C0',alpha=0.8)
plt.plot(t[idx2],x[idx2],'o',color='C3')
plt.axhline(lt2,color='k',ls='--',lw=1)
plt.axhline(ut2,color='k',ls='--',lw=1)
plt.ylabel('x')
plt.title('Outliers using  SD')
plt.show()