spkit.spatial_filter_dist
- spkit.spatial_filter_dist(X, V, r=0.1, ftype='mean', exclude_self=False, sort_with_dist=False, default_value=nan, esp=0)
Spatial Filter with Distance (Proximity)
Spatial Filter with Distance
Note
It is same as Graph Filtering, with special case as 3D
A value of a vertice (node) is refined by value of neibouring vertices (nodes)
The refinement could be - mean, media, standard deviation or any custom operation passed to function as
ftypeCommonly a filter operation could be permutation invariant, such as np.mean, np.median, np.std, However for custom operation passed as functionftype, values can be passed in sorted order by turningsort_with_dist=True- Parameters:
- X: 1d-array (n,)
values of vertices iof graph
- V: array - shape (n,d)
location of vertices in d-dimensional sapce
for 3D Geomartry, (n,3)
- r: float,
radius/distance of the vertices to be considered
- ftype: str, or Callable, default=’mean’
filter operation, {‘mean’,’median’,’std’,’min’,’max’} or any numpy operation as str = ‘np.newfun’
using ‘mean’ , value of vertices is refined with average of neibours defined by distance d.
if
ftypeis callable, make sure it return single value given neigbours values
- exclude_self: bool, default=False,
if True, while refining/filtering the value of the vertice, value of itself if excluded.
- default_value: float, default=np.nan
default value to start with.
In case of no neibours and excluding itself, vertices will have this value.
- esp: used for excluding itself
- sort_with_dist:bool, default=False
if True, values passed to filter are sorted in order of smallest distance to largest
in case of permutation variant filter, this could be used.
it adds extra computations, so turn it off, if not useful.
- Returns:
- Y: 1d-array of same size as X
refined/filtered values
See also
Examples
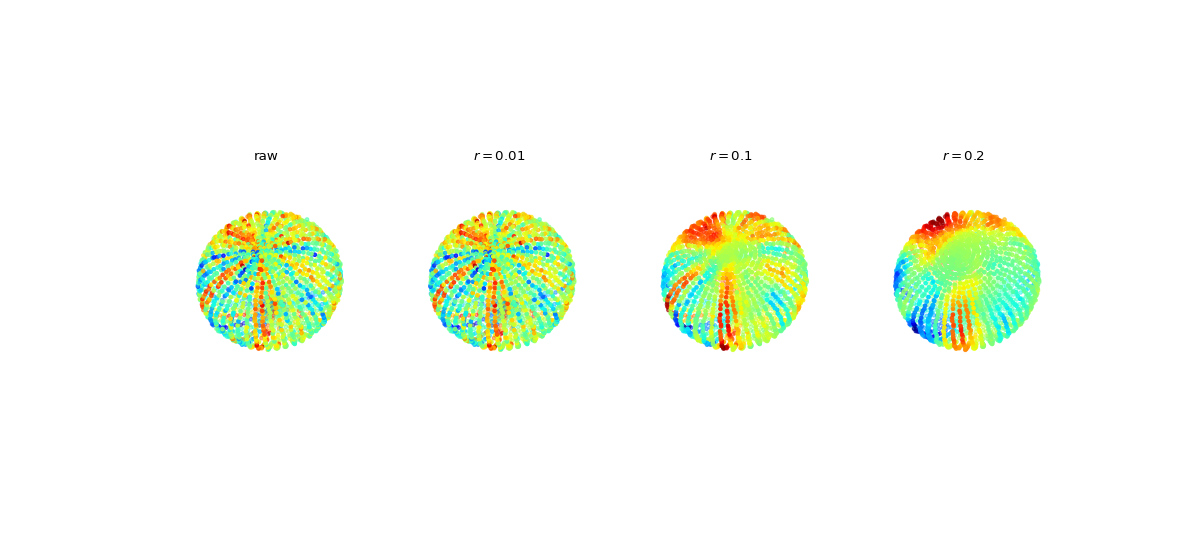
#sp.spatial_filter_dist
import numpy as np
import matplotlib.pyplot as plt
import spkit as sp

V = sp.geometry.get_ellipsoid(n1=50, n2=50, rx=1, ry=2, rz=1,)
V += 0.01*np.random.randn(V.shape[0],V.shape[1])
X = sp.create_signal_1d(V.shape[0],bipolar=False,sg_winlen=21,sg_polyorder=2,seed=1)
X += 0.1*np.random.randn(X.shape[0])

Y1 = sp.spatial_filter_dist(X,V,r=0.01,ftype='mean',exclude_self=False)
Y2 = sp.spatial_filter_dist(X,V,r=0.2,ftype='mean',exclude_self=False)
Y3 = sp.spatial_filter_dist(X,V,r=0.5,ftype='mean',exclude_self=False)

fig, ax = plt.subplots(1,4,subplot_kw={"projection": "3d"},figsize=(15,7))

Ys =[X, Y1, Y2, Y3]
TITLEs = ['raw', r'$r=0.01$',r'$r=0.1$', r'$r=0.2$']
for i in range(4):
    ax[i].scatter3D(V[:,0], V[:,1], V[:,2], c=Ys[i], cmap='jet',s=10)
    ax[i].axis('off')
    ax[i].view_init(elev=60, azim=45, roll=15)
    ax[i].set_xlim([-1,1])
    ax[i].set_ylim([-2,2])
    ax[i].set_zlim([-1,1])
    ax[i].set_title(TITLEs[i])

plt.subplots_adjust(hspace=0,wspace=0)
plt.show()