spkit.peak_interp
- spkit.peak_interp(mX, pX, ploc)
Interpolate peak using parabolic interpolation
Interpolate peak values using parabolic interpolation
- refined loction:
- \[kp_{new} = kp + 0.5*(X[kp-1] - X[kp+1])/(X[kp-1] -2*X[kp]+X[kp+1])\]
- refined value:
- \[X_{new} = X[kp] + 0.25*(kp_new - kp)*(X[kp-1] - X[kp+1])\]
- Parameters:
- mXmagnitude spectrum
- pXphase spectrum
- ploc: locations of peaks
- Returns:
- interpolated - refined locations of frequencies and corresponding magnitude and phase:
- iplocpeak location
- ipmagmagnitude values
- ipphase: phase values
Examples
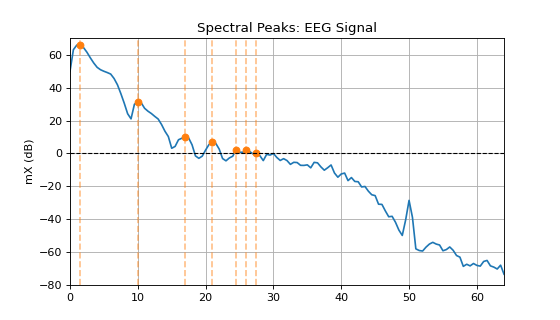
#sp.peak_interp
import numpy as np
import matplotlib.pyplot as plt
import spkit as sp
X, fs, ch_names = sp.data.eeg_sample_14ch()
x = X[:,0]
mX, fr = sp.periodogram(x,fs=fs)
N = (len(fr)-1)*2
mX = 20*np.log10(mX)
ploc = sp.peak_detection(mX, thr=0)
iploc, _, _ = sp.peak_interp(mX, pX=mX, ploc=ploc)
peak_int = fs*iploc/N
print('Peaks Detected     :',fr[ploc],'Hz')
print('Peaks Interpolated :',peak_int.round(1),'Hz')
plt.figure(figsize=(7,4))
plt.plot(fr,mX)
plt.plot(fr[ploc],mX[ploc],'o')
plt.vlines(fr[ploc],ymin=-80,ymax=70,color='C1',ls='--',alpha=0.5)
plt.axhline(0,color='k',lw=1,ls='--')
plt.ylim([-80,70])
plt.xlim([0,fr[-1]])
plt.grid()
plt.ylabel('mX (dB)')
plt.title('Spectral Peaks: EEG Signal')
plt.show()
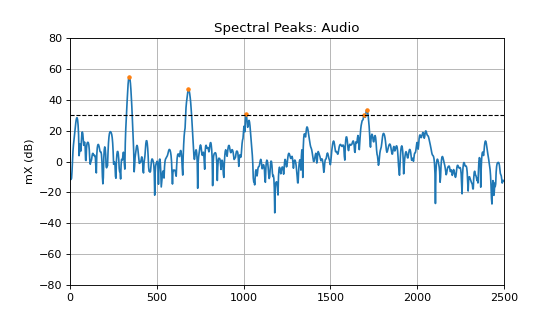
#####################################
#sp.peak_interp
import requests
from scipy.io import wavfile
import numpy as np
import matplotlib.pyplot as plt
import spkit as sp

path = 'https://github.com/MLEndDatasets/samples/raw/main/HWD_HP_hum_1.wav?raw=True'
req = requests.get(path)
with open('downloaded_file.wav', 'wb') as f:
        f.write(req.content)
fs, x = wavfile.read('downloaded_file.wav')
t = np.arange(x.shape[0])/fs
mX, pX, N = sp.dft_analysis(x[int(1*fs):int(1.2*fs)])
fr = (fs/2)*np.arange(len(mX))/(len(mX)-1)
thr = 30
ploc = sp.peak_detection(mX, thr=thr)
iploc, ipmag, ipphase = sp.peak_interp(mX, pX, ploc)
peak_int = fs*iploc/N

print('Peaks detected      : ',fr[ploc], 'Hz')
print('Peaks Interpolated  : ',peak_int, 'Hz')

plt.figure(figsize=(7,4))
plt.plot(fr,mX)
plt.plot(fr[ploc],mX[ploc],'.')
plt.axhline(thr,color='k',lw=1,ls='--')
plt.ylim([-80,80])
plt.xlim([-1,2500])
plt.grid()
plt.ylabel('mX (dB)')
plt.title('Spectral Peaks: Audio')
plt.show()