spkit.geometry.get_adjacency_matrix_kNN
- spkit.geometry.get_adjacency_matrix_kNN(V, K=5, remove_self_con=True, verbose=False, ignore_matrix=False)
Create Adjacency Index Matrix based on Euclidean distance kNN
- Parameters:
- V: Points, (n,d)
n-points in d-dimentional space
- K: int,
number of nearest neibhbour
- remove_self_con: bool,
if true, self point is excluded from neareast neighbours
- Returns:
- AdjM: Adjacency Index Matrix,
(n, K) shape, index of neareast points, in accending order of distance
- node2C: dict,
Dictionary of node to connection list node2C[node_a] = list_of_nodes_connected_to_node_a
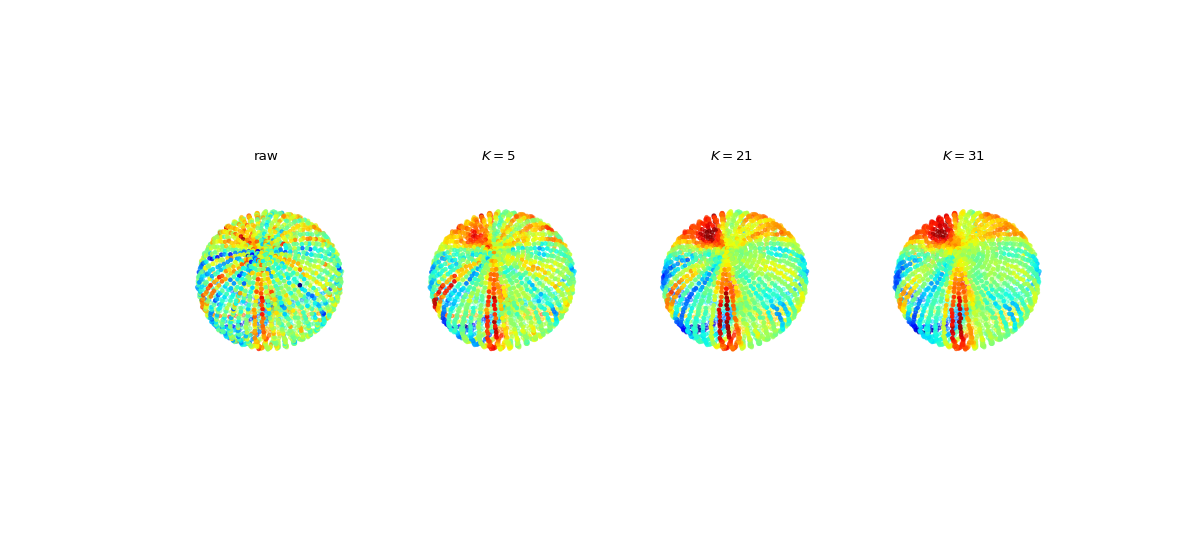
Examples
#sp.geometry.get_adjacency_matrix_kNN
import numpy as np
import matplotlib.pyplot as plt
import spkit as sp

V = sp.geometry.get_ellipsoid(n1=50, n2=50, rx=1, ry=2, rz=1,)
V += 0.01*np.random.randn(V.shape[0],V.shape[1])

X = sp.create_signal_1d(V.shape[0],bipolar=False,sg_winlen=21,sg_polyorder=2,seed=1)
X += 0.1*np.random.randn(X.shape[0])

AdjM1, _  = sp.geometry.get_adjacency_matrix_kNN(V, K=5)
AdjM2, _  = sp.geometry.get_adjacency_matrix_kNN(V, K=21)
AdjM3, _  = sp.geometry.get_adjacency_matrix_kNN(V, K=31)

Y1 = sp.graph_filter_adj(X,AdjM1,ftype='mean',exclude_self=False)
Y2 = sp.graph_filter_adj(X,AdjM2,ftype='mean',exclude_self=False)
Y3 = sp.graph_filter_adj(X,AdjM3,ftype='mean',exclude_self=False)

fig, ax = plt.subplots(1,4,subplot_kw={"projection": "3d"},figsize=(15,7))

Ys =[X, Y1, Y2, Y3]
TITLEs = ['raw', r'$K=5$',r'$K=21$', r'$K=31$']
for i in range(4):
    ax[i].scatter3D(V[:,0], V[:,1], V[:,2], c=Ys[i], cmap='jet',s=10)
    ax[i].axis('off')
    ax[i].view_init(elev=60, azim=45, roll=15)
    ax[i].set_xlim([-1,1])
    ax[i].set_ylim([-2,2])
    ax[i].set_zlim([-1,1])
    ax[i].set_title(TITLEs[i])

plt.subplots_adjust(hspace=0,wspace=0)
plt.show()