spkit.f0_detection
- spkit.f0_detection(x, fs, winlen, nfft=None, overlap=None, window='hann', thr=-10, f0min=0.01, f0max=None, f0err=1, return_cand=False)
Fundamental frequency detection using TWM
Fundamental frequency detection of a signal using TWM algorithm
- Parameters:
- x1d-array - input signal
- fs: sampling rate
- winlen: window length for analysis
- overlap: overlap of windows
: if None then winlen//4 is used (25% overlap) : shorter overlap can improve time resoltion - upto an extend
- window: analysis window (default = hann)
: if None, rectangular window is used
- nfft: FFT size, should be >=winlen and power of 2
: if None - nfft = 2**np.ceil(np.log2(len(n)))
- thr: threshold for selecting frequencies (in negative dB) -default =-10
- f0min: minimum f0 frequency in Hz (default=0.01)
- f0max: maximim f0 frequency in Hz - if None (default)=fs/2
- f0err: error threshold in the f0 detection (default 1)
- return_cand: bool, if True, returns all candidate frequencies in given range (f0min<=f0cand<=f0max)
: with correspoding magnitude and phase : default False
- Returns:
- f0: fundamental frequencies of each window
: f0=0 is refered to frame where no fundamental frequency is found.
- if return_cand True:
- f0_cand: candidates of fundamental frequency
- f0_magmagnitude of candidates fundamental frequency
Examples
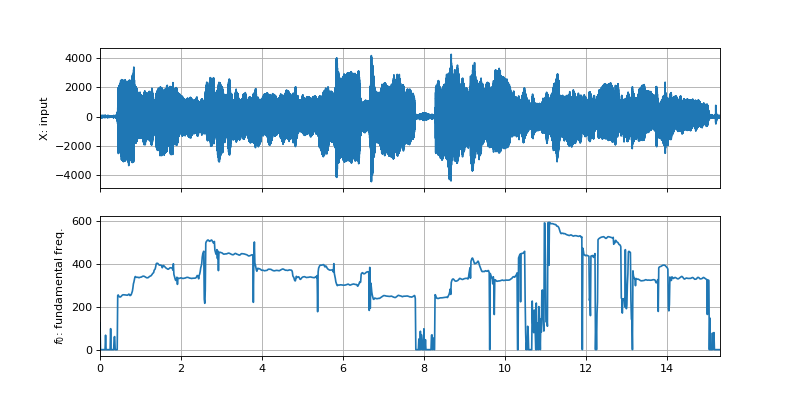
>>> import numpy as np
>>> import matplotlib.pyplot as plt
>>> import spkit as sp
>>> import requests
>>> from scipy.io import wavfile
>>> #sp.f0_detection
>>> path = 'https://github.com/MLEndDatasets/samples/raw/main/HWD_HP_hum_1.wav?raw=True'
>>> req = requests.get(path)
>>> with open('downloaded_file.wav', 'wb') as f:
>>>        f.write(req.content)
>>> fs, x = wavfile.read('downloaded_file.wav')
>>> t = np.arange(x.shape[0])/fs
>>> f0 = sp.f0_detection(x,fs,winlen=fs//20)
>>> t0 = t[-1]*np.arange(f0.shape[0])/(f0.shape[0]-1)
>>> fig, (ax1, ax2) = plt.subplots(2, 1, gridspec_kw={'height_ratios': [1,1]},figsize=(10,5))
>>> ax1.plot(t,x)
>>> ax1.set_xlim([t[0],t[-1]])
>>> ax1.set_ylabel('X: input')
>>> ax1.grid()
>>> ax1.set_xticklabels('')
>>> ax2.plot(t0,f0)
>>> ax2.set_xlim([t0[0],t0[-1]])
>>> ax2.set_ylabel(r'$f_0$: fundamental freq.')
>>> ax2.grid()
>>> ax2.set_label('time (s)')
>>> plt.show()