spkit.eeg.RhythmicDecomposition
- spkit.eeg.RhythmicDecomposition(E, fs=128.0, order=5, method='welch', win='hann', Sum=True, Mean=False, SD=False, scaling='density', nfft=None, average='mean', detrend='constant', nperseg=None, noverlap=None, fBands=None, use_joblib=False)
Compute powers of different Rhythms of EEG Signal
Decompose EEG Signal(s)-all the channels in Rhythms and compute power in each band for each channel
Deprecated since version 0.0.9.7: USE
rhythmic_powersfor updated versionWarning
DEPRECATED USE
rhythmic_powersfor updated version- Parameters:
- E: EEG segment of shape (n,nch)
- fs: sampling rate
- fBands: list of frequency bands - if None: fBands =[[4],[4,8],[8,14],[14,30],[30,47],[47]]
- Returns:
- Px: sum of the power in a band - shape (number of bands,nch)
- Pm: mean power in a band - shape (number of bands,nch)
- Pd: standard deviation of power in a band - shape (number of bands,nch)
See also
References
Examples
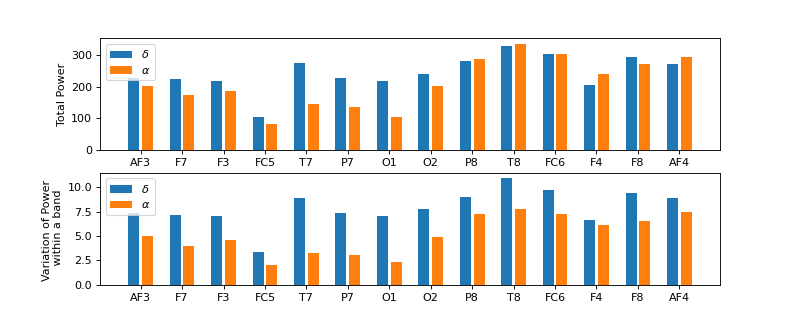
#sp.eeg.RhythmicDecomposition
import numpy as np
import matplotlib.pyplot as plt
import spkit as sp
X,fs, ch_names = sp.data.eeg_sample_14ch()
X = sp.filterDC_sGolay(X, window_length=fs//3+1)

Px,Pm,Pd = sp.eeg.RhythmicDecomposition(E=X,fs=fs,fBands=[[4],[8,14]],Sum=True,Mean=True,SD =True)

bind = np.arange(len(ch_names))
plt.figure(figsize=(10,4))
plt.subplot(211)
plt.bar(bind*3,Px[0],label=r'$\delta$')
plt.bar(bind*3+1,Px[1],label=r'$\alpha$')
plt.xticks(bind*3+0.5,ch_names)
plt.legend()
plt.ylabel('Total Power')
plt.subplot(212)
plt.bar(bind*3,Pd[0],label=r'$\delta$')
plt.bar(bind*3+1,Pd[1],label=r'$\alpha$')
plt.xticks(bind*3+0.5,ch_names)
plt.legend()
plt.ylabel('Variation of Power \n within a band')
plt.show()