spkit.eeg.gen_ssfi
- spkit.eeg.gen_ssfi(PX, pos, res=64, NormalizeEachBand=False, verbose=1)
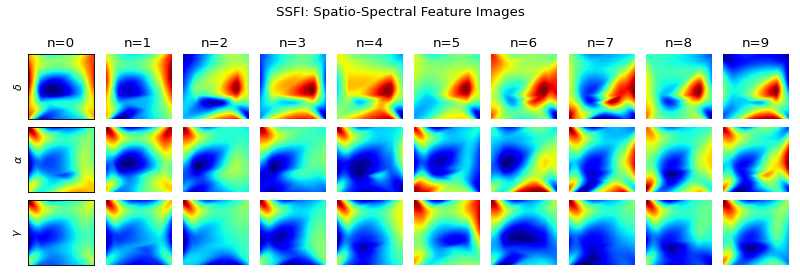
Generating Spatio-Spectral Feature Image (SSFI)
Spatio-Spectral Feature Images
Input - PX : (100,6,14) or (100,6*14)
Output - Ximg : (100,6,64,64)
- Parameters:
- PX: 2D-array or 3D-array,
Power values of the each band and each channel
- if 2D-array
shape of (nt , N*M)
where nt=number of segments, N=number of frequency bands, M=number of channels
- e.g:
for 5 chennels, three bands, power values of each band is in sequence - PX[0] = [1,2,3,4,5, 1,2,3,4,5, 6,1,2,3,4,5] - PX.shape = (100, 3*5), 100 time instant, 3 bands and 5 channels
- if 3D-array
shape of (nt, N, M)
where nt=number of segments, N=number of frequency bands, M=number of channels
- e.g:
for 5 chennels, three bands, power values of each band is in sequence - PX.shape = (100, 3, 14), 100 time instant, 3 bands and 14 channels
- pos: 2D projections
shape = (M,2)
number of channel M same in order as values
- res: int default=64
resolution of SSFI
- NormalizeEachBand: bool, Default=False
If True, power values of each band are normalised
it is useful, if distribution if more improtant than power values
- Returns:
- Ximg: 3D-Array
(nt,N, res, res)
References
[1] Bajaj N, Requena Carrión J., (2023, August). Deep Representation of EEG Signals Using Spatio-Spectral Feature Images. Applied Sciences. 2023; 13(17):9825. https://doi.org/10.3390/app13179825. [Link]
Examples
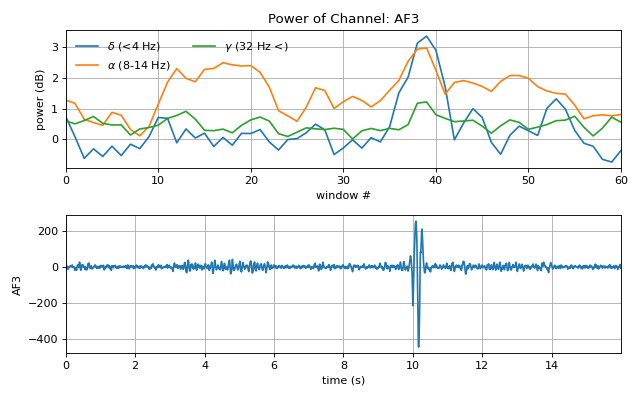
#sp.eeg.gen_ssfi
import numpy as np
import matplotlib.pyplot as plt
import spkit as sp
X,fs, ch_names = sp.data.eeg_sample_14ch()
X = sp.filterDC_sGolay(X, window_length=fs//3+1)
t = np.arange(X.shape[0])/fs
Pxt, _, _ = sp.eeg.rhythmic_powers_win(X, winsize=128,overlap=32,fBands=[[4],[8,14],[32,47]],Sum=True)
Pxt = np.log10(Pxt)
pos, ch = sp.eeg.s1020_get_epos2d(ch_names,style='spkit')
Ximg = sp.eeg.gen_ssfi(Pxt,pos=pos, res=64)

plt.figure(figsize=(8,5))
plt.subplot(211)
plt.plot(Pxt[:,:,0], label=[r'$\delta$ (<4 Hz)',r'$\alpha$ (8-14 Hz)',r'$\gamma$ (32 Hz <)',])
plt.xlabel('window #')
plt.ylabel('power (dB)')
plt.title(f'Power of Channel: {ch_names[0]}')
plt.xlim([0,Pxt.shape[0]-1])
plt.grid()
plt.legend(ncol=2,frameon=False)
plt.subplot(212)
plt.plot(t,X[:,0])
plt.grid()
plt.xlim([t[0],t[-1]])
plt.xlabel('time (s)')
plt.ylabel(ch_names[0])
plt.tight_layout()
plt.show()
plt.figure(figsize=(10,3.5))
for i in range(10):
    plt.subplot(3,10,i+1)
    plt.imshow(Ximg[i,0],cmap='jet')
    plt.title(f'n={i}')
    if i==0:
        plt.ylabel(r'$\delta$')
        plt.xticks([])
        plt.yticks([])
    else:
        plt.axis('off')
    plt.subplot(3,10,10+i+1)
    plt.imshow(Ximg[i,1],cmap='jet')
    if i==0:
        plt.ylabel(r'$\alpha$')
        plt.xticks([])
        plt.yticks([])
    else:
        plt.axis('off')
    plt.subplot(3,10,20+i+1)
    plt.imshow(Ximg[i,2],cmap='jet')
    if i==0:
        plt.ylabel(r'$\gamma$')
        plt.xticks([])
        plt.yticks([])
    else:
        plt.axis('off')

plt.suptitle('SSFI: Spatio-Spectral Feature Images')
plt.tight_layout()
plt.show()