Ramanujan Dictionary - with L_1 sparse penalty
Contents
Ramanujan Dictionary - with sparse penalty
import numpy as np
import matplotlib.pyplot as plt
import sys, scipy
from scipy import linalg as LA
import spkit as sp
sp.__version__
'0.0.9.4'
Ramanujan Dictionary - with \(L_1\) sparse penalty
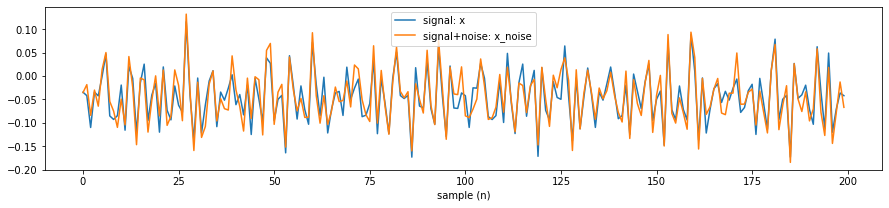
Signal with 3-periods and SNR=10
#np.random.seed(None)

periods    = [3,7,11]
signal_length = 200
SNR = 10

x = np.zeros(signal_length)

for period in periods:
    x_temp  = np.random.randn(period)
    x_temp  = np.tile(x_temp,int(np.ceil(signal_length/period)))
    x_temp  = x_temp[:signal_length]
    x_temp /= LA.norm(x_temp,2)
    x += x_temp

x /= LA.norm(x,2)


noise  = np.random.randn(len(x))
noise /= LA.norm(noise,2)
noise_power = 10**(-1*SNR/20)
noise *= noise_power
x_noise = x + noise

plt.figure(figsize=(15,3))
plt.plot(x,label='signal: x')
plt.plot(x_noise, label='signal+noise: x_noise')
plt.xlabel('sample (n)')
plt.legend()
plt.show()
With L1 and sparse penalty
periodE = sp.PeriodStrength(x_noise,Pmax=80,method='Ramanujan',lambd=1, L=1, cvxsol=True)

plt.stem(np.arange(len(periodE))+1,periodE)
plt.xlabel('period (in samples)')
plt.ylabel('strength')
plt.title('L1 + penality')
plt.show()

print('top 10 periods: ',np.argsort(periodE)[::-1][:10]+1)
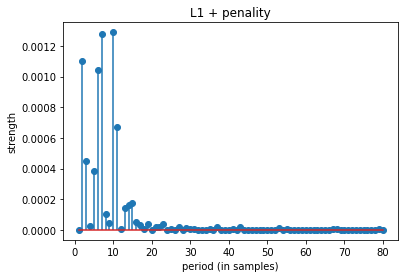
top 10 periods: [10 7 2 6 11 3 5 15 14 13]
With L1 with no penalty
periodE = sp.PeriodStrength(x_noise,Pmax=80,method='Ramanujan',lambd=0, L=1, cvxsol=True)

plt.stem(np.arange(len(periodE))+1,periodE)
plt.xlabel('period (in samples)')
plt.ylabel('strength')
plt.title('L1 + no penality')
plt.show()

print('top 10 periods: ',np.argsort(periodE)[::-1][:10]+1)
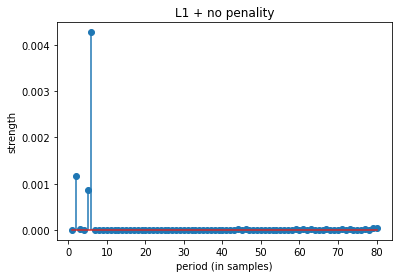
top 10 periods: [ 6 2 5 79 80 3 77 71 67 61]
With L2 and sparse penalty
periodE = sp.PeriodStrength(x_noise,Pmax=80,method='Ramanujan',lambd=1, L=2, cvxsol=False)

plt.stem(np.arange(len(periodE))+1,periodE)
plt.xlabel('period (in samples)')
plt.ylabel('strength')
plt.title('L2 + penality')
plt.show()

print('top 10 periods: ',np.argsort(periodE)[::-1][:10]+1)
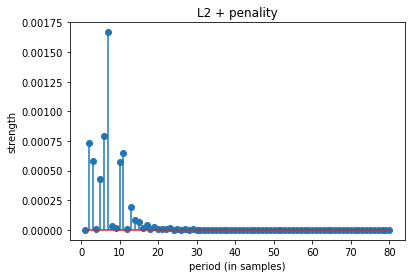
top 10 periods: [ 7 6 2 11 3 10 5 13 14 15]
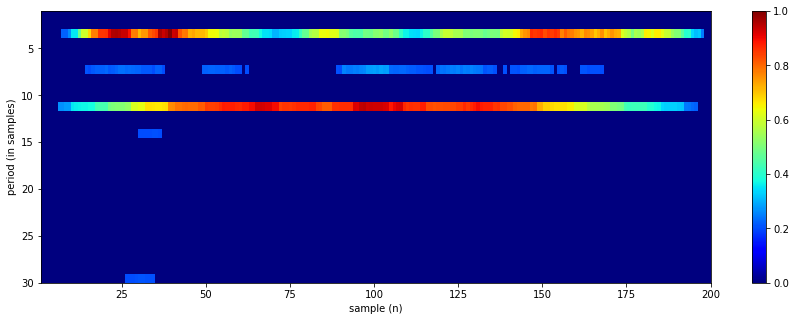
With RFB
y,Plist = sp.RFB_prange(x=x_noise,Pmin=1,Pmax=30, Rcq=10, Rav=2, thr=0.2,return_filters=False)

plt.figure(figsize=(15,5))
im = plt.imshow(y.T,aspect='auto',cmap='jet',extent=[1,len(x_noise),30,1])
plt.colorbar(im)
plt.xlabel('sample (n)')
plt.ylabel('period (in samples)')
plt.show()

Penrgy = np.sum(y,0)

plt.stem(Plist,Penrgy)
plt.xlabel('period (in samples)')
plt.ylabel('strength')
plt.show()

print('top 10 periods: ',Plist[np.argsort(Penrgy)[::-1]][:10])
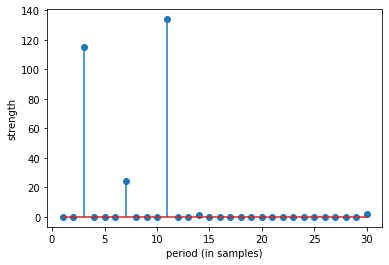
top 10 periods: [11 3 7 30 14 29 2 4 5 6]
help(sp.PeriodStrength)
Help on function PeriodStrength in module core.ramanujam_methods:

PeriodStrength(x, Pmax, method='Ramanujan', lambd=1, L=1, cvxsol=False)
    Computing strength of periods
    -----------------------------
    for given signal x, using method and respective loss fun (e.g. l1, l2)

    inputs
    -----
    x   :  one dimentional sequence (signal)
    Pmax: largest expected period in the signal
    method: type of dictionary used to create transform matrix A
          : 'Ramanujan', 'NaturalBasis', 'random' or Farray (DFT)

    lambd: for penalty vector, to force towards lower (usually) or higher periods
         : if 0, then penalty vector is 1, means no penalization
         : if >0, then lambd is multiplied to penalty vector

    L : regularazation: L=1, minimize ||s||_1, L=2, ||s||_2

    cvxsol: bool, wether to use cvxpy solver of matrix decomposition approach
          : matrix decomposition approach works only for L=2
          : for L=1, use cvxpy as solver

    output
    ------
    period_energy: vecotor shape: (Pmax,): strength of each period


    Reference:
    [1] S.V. Tenneti and P. P. Vaidyanathan, "Nested Periodic Matrices and Dictionaries:
       New Signal Representations for Period Estimation", IEEE Transactions on Signal
       Processing, vol.63, no.14, pp.3736-50, July, 2015.

    Python impletation is done by using matlab code version from
    - http://systems.caltech.edu/dsp/students/srikanth/Ramanujan/