Ramanujan Filter Banks with a signal
Contents
Ramanujan Filter Banks: signal
import numpy as np
import matplotlib.pyplot as plt
import sys, scipy
from scipy import linalg as LA
import spkit as sp
Ramanujan Filter Banks with a signal
Ramanujan Filter Banks [1] based on Ramanujan sum defined as:
\[c_q(n) = \sum_{k=1, gcd(k,q)=1}^{q} W_q^{kn} + \sum_{k=1, gcd(k,q)=1}^{q} W_q^{-kn}\]
where \(W_q = e^{j2\pi/q}\)
References:
[1] Vaidyanathan, Palghat P., and Srikanth Tenneti. “Srinivasa Ramanujan and signal-processing problems.” Philosophical Transactions of the Royal Society A 378.2163 (2020): 20180446.
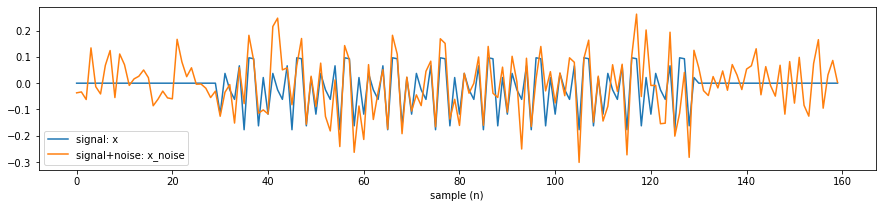
Signal with period 10 and SNR=0
period = 10
SNR = 0

x0 = np.zeros(30)
x1 = np.random.randn(period)
x1 = np.tile(x1,10)
x  = np.r_[x0,x1,x0]
x /= LA.norm(x,2)

noise  = np.random.randn(len(x))
noise /= LA.norm(noise,2)

noise_power = 10**(-1*SNR/20)

noise *= noise_power
x_noise = x + noise

plt.figure(figsize=(15,3))
plt.plot(x,label='signal: x')
plt.plot(x_noise, label='signal+noise: x_noise')
plt.xlabel('sample (n)')
plt.legend()
plt.show()
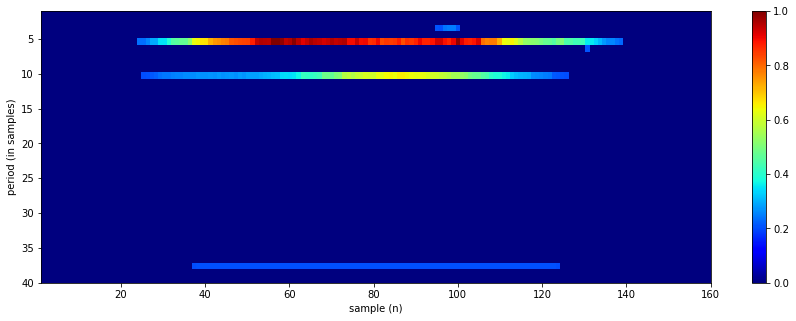
Period Estimation
Pmax = 40  # Maximum period expected
Rcq  = 10  # Number of repeats in each Ramanujan filter
Rav  = 2   # Number of repeats in each averaging filter
Th   = 0.2 # Threshold zero out the output

y,FR, FA = sp.RFB(x_noise,Pmax=Pmax, Rcq=Rcq, Rav=Rav, Th=Th,return_filters=True)

plt.figure(figsize=(15,5))
im = plt.imshow(y.T,aspect='auto',cmap='jet',extent=[1,len(x_noise),Pmax,1])
plt.colorbar(im)
plt.xlabel('sample (n)')
plt.ylabel('period (in samples)')
plt.show()

plt.stem(np.arange(1,y.shape[1]+1),np.sum(y,0))
plt.xlabel('period (in samples)')
plt.ylabel('strength')
plt.show()

print('top 10 periods: ',np.argsort(np.sum(y,0))[::-1][:10]+1)
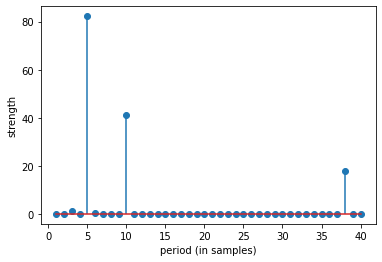
top 10 periods: [ 5 10 38 3 6 40 12 17 16 15]
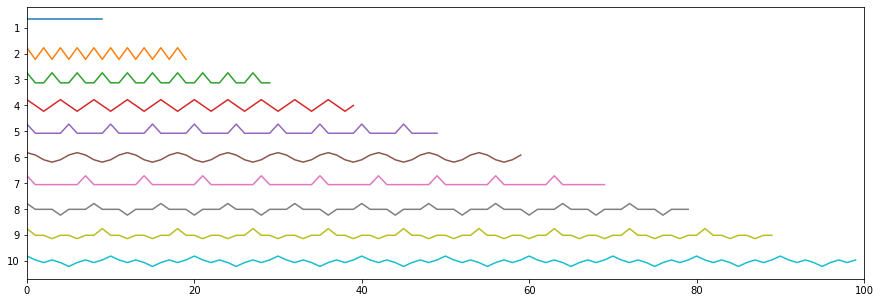
Ramanujan filter
First 10 filters
plt.figure(figsize=(15,5))
for i in range(10):
    plt.plot(FR[i] - i*1)

plt.xlim([0,len(FR[i])])
plt.yticks(-np.arange(10), np.arange(1,10+1))
plt.show()
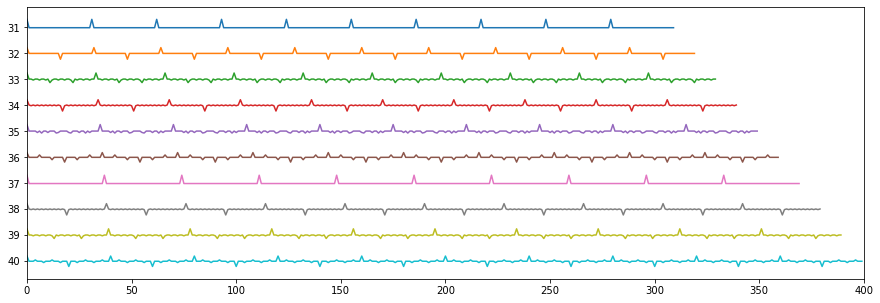
30-40 filters
plt.figure(figsize=(15,5))
for i in range(30,40):
    plt.plot(FR[i] - (i-30)*1)

plt.xlim([0,len(FR[i])])
plt.yticks(-np.arange(10), np.arange(1,10+1)+30)
plt.show()
Period Estimation from specific range of period
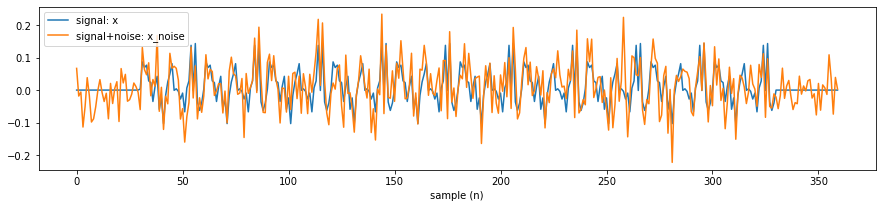
Signal with period 30
period = 30
SNR = 0

x0 = np.zeros(30)
x1 = np.random.randn(period)
x1 = np.tile(x1,10)
x  = np.r_[x0,x1,x0]
x /= LA.norm(x,2)

noise  = np.random.randn(len(x))
noise /= LA.norm(noise,2)

noise_power = 10**(-1*SNR/20)

noise *= noise_power
x_noise = x + noise

plt.figure(figsize=(15,3))
plt.plot(x,label='signal: x')
plt.plot(x_noise, label='signal+noise: x_noise')
plt.xlabel('sample (n)')
plt.legend()
plt.show()
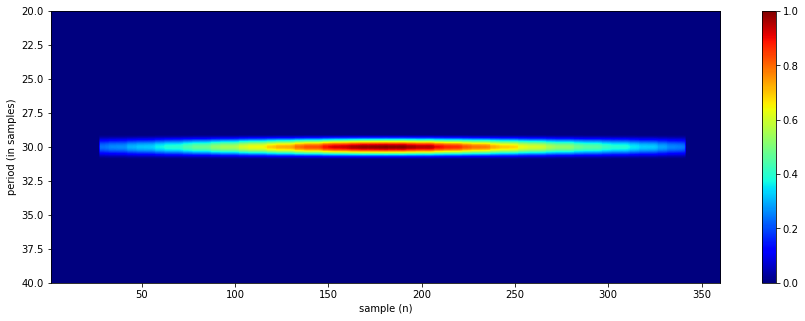
Period estimation with range
y,Plist = sp.RFB_prange(x=x_noise,Pmin=20,Pmax=40, Rcq=10, Rav=2, thr=0.2,return_filters=False)

plt.figure(figsize=(15,5))
im = plt.imshow(y.T,aspect='auto',cmap='jet',extent=[1,len(x_noise),40,20])
plt.colorbar(im)
plt.xlabel('sample (n)')
plt.ylabel('period (in samples)')
plt.show()

Penrgy = np.sum(y,0)

plt.stem(Plist,Penrgy)
plt.xlabel('period (in samples)')
plt.ylabel('strength')
plt.show()

print('top 10 periods: ',Plist[np.argsort(Penrgy)[::-1]][:10])
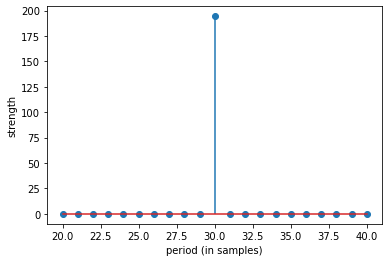
top 10 periods: [30 29 21 22 23 24 25 26 27 28]
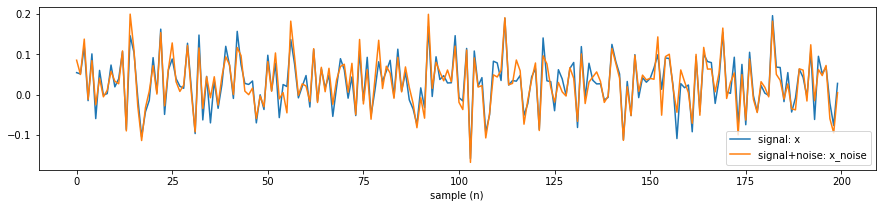
Multiple periods
periods    = [10,14,18]
signal_length = 200
SNR = 10

x = np.zeros(signal_length)

for period in periods:
    x_temp  = np.random.randn(period)
    x_temp  = np.tile(x_temp,int(np.ceil(signal_length/period)))
    x_temp  = x_temp[:signal_length]
    x_temp /= LA.norm(x_temp,2)
    x += x_temp

x /= LA.norm(x,2)


noise  = np.random.randn(len(x))
noise /= LA.norm(noise,2)
noise_power = 10**(-1*SNR/20)
noise *= noise_power
x_noise = x + noise

plt.figure(figsize=(15,3))
plt.plot(x,label='signal: x')
plt.plot(x_noise, label='signal+noise: x_noise')
plt.xlabel('sample (n)')
plt.legend()
plt.show()
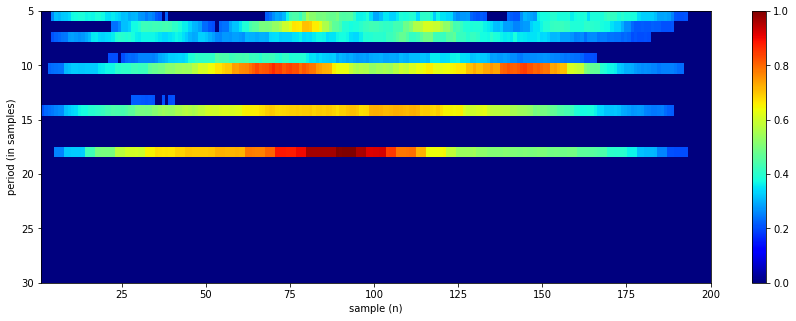
y,Plist = sp.RFB_prange(x=x_noise,Pmin=5,Pmax=30, Rcq=10, Rav=2, thr=0.2,return_filters=False)

plt.figure(figsize=(15,5))
im = plt.imshow(y.T,aspect='auto',cmap='jet',extent=[1,len(x_noise),30,5])
plt.colorbar(im)
plt.xlabel('sample (n)')
plt.ylabel('period (in samples)')
plt.show()

Penrgy = np.sum(y,0)

plt.stem(Plist,Penrgy)
plt.xlabel('period (in samples)')
plt.ylabel('strength')
plt.show()

print('top 10 periods: ',Plist[np.argsort(Penrgy)[::-1]][:10])
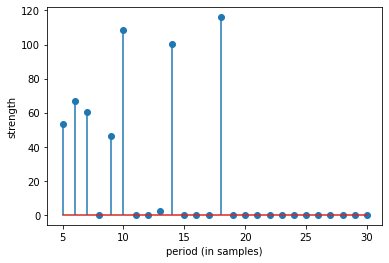
top 10 periods: [18 10 14 6 7 5 9 13 16 8]
help(sp.RFB_prange)
Help on function RFB_prange in module core.ramanujam_methods:

RFB_prange(x, Pmin=1, Pmax=10, skip=1, Rcq=10, Rav=2, thr=0.2, Penalty=None, return_filters=False, apply_averaging=True)
    Ramanujan Filter Banks for Estimation and Tracking of Periodicity
    -----------------------------------------------------------------
    - for range of period given by Pmin and Pmax.

    input
    ------
    x    = 1d array, sequence of signal
    Pmin = the smallest expected period. (default=1)
    Pmax = the largest expected period.
    skip = int >=1: if to skip period (default=1 --> no skipping) (>1 is not recomended)
    Rcq  = Number of repeats in each Ramanujan filter
    Rav  = Number of repeats in each averaging filter
    thr   = Outputs of the RFB are thresholded to zero for all values less than Th*max(output)
    Penalty = penalty for each period shape=(len(Pmax)),
             If None, then set to 1, means no penalty
    apply_averaging: bool, if False, no averaging is applied (deault=True)
    return_filters: bool, ifTrue, return FR - Ramanujan and FA - Averaging filters

    output
    ------
    y = 2d array of shape = (len(x),Pmax), time vs period matrix, normalized

    if return_filters==True: also returns

    FR = list of Ramanujan Filters
    FA = list of Averaging Filters

    References:
    [1] S.V. Tenneti and P. P. Vaidyanathan, "Ramanujan Filter Banks for Estimation
    and Tracking of Periodicity", Proc. IEEE Int. Conf. Acoust.
    Speech, and Signal Proc., Brisbane, April 2015.

    [2] P.P. Vaidyanathan and S.V. Tenneti, "Properties of Ramanujan Filter Banks",
    Proc. European Signal Processing Conference, France, August 2015.

    Python impletation is done by using matlab code version from
    - http://systems.caltech.edu/dsp/students/srikanth/Ramanujan/